
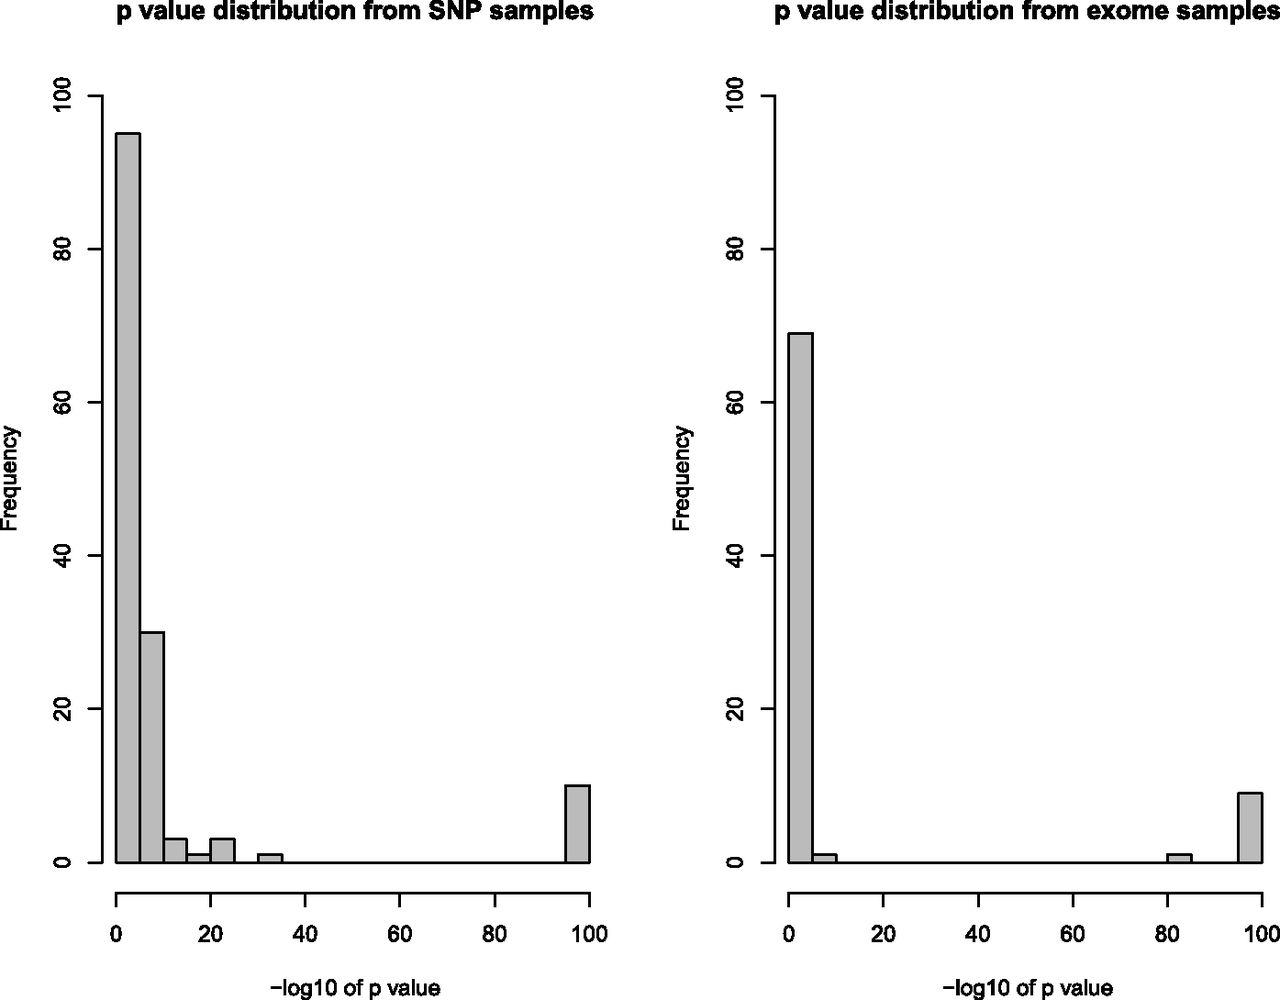
Figure 6.
DDD UPD P-value distributions. Distribution of the –log10 P-values for UPD detections from different data sources, with or without CNV data. Presence of sample-specific CNV data increases the proportion of extremely significant events and decreases the proportion of marginally significant events. P-value minimum truncated to 1 × 10−100.


