
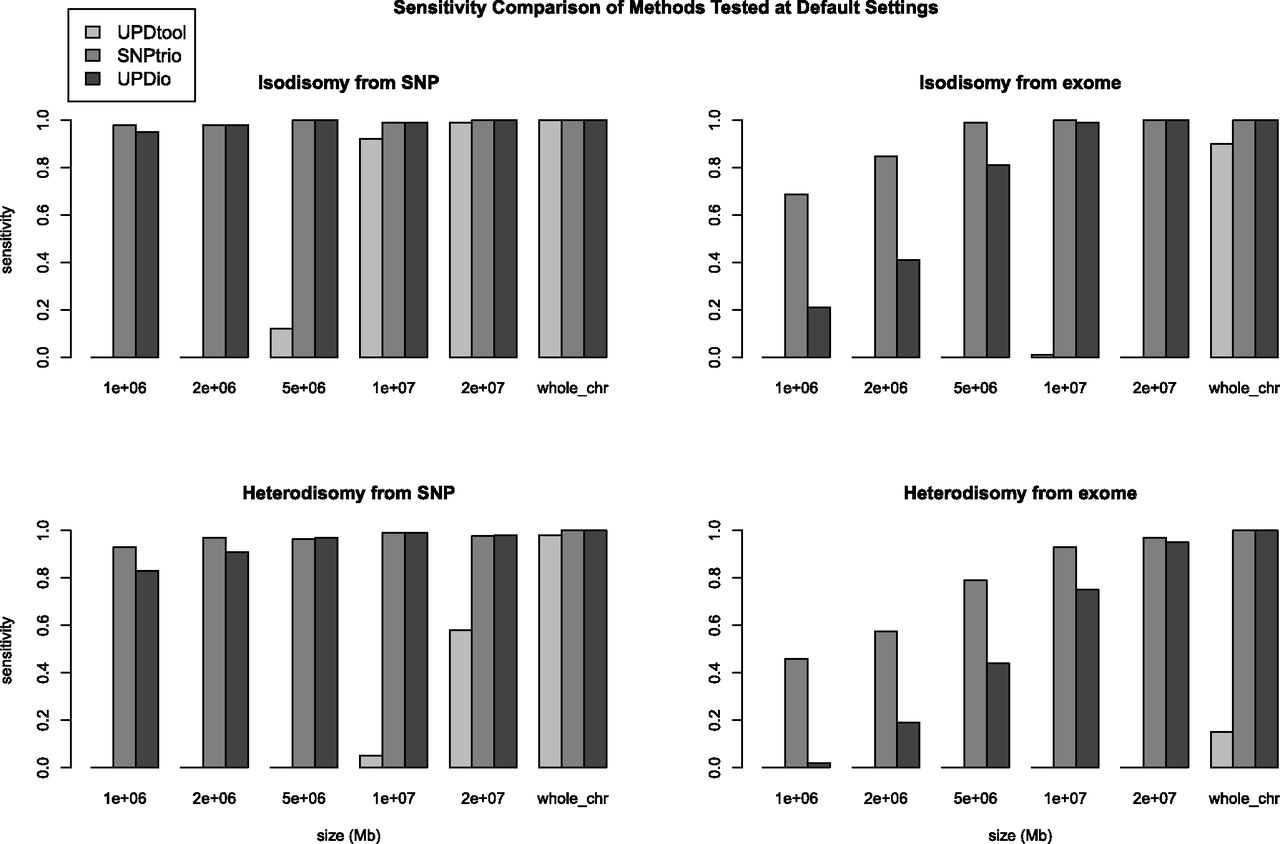
Figure 3.
Sensitivity comparisons. Simulations were performed to measure the sensitivity of detecting introduced UPD events from SNP and exome data, ranging in size from 1 Mb to chromosomal.
(Downloading may take up to 30 seconds. If the slide opens in your browser, select File -> Save As to save it.)
Click on image to view larger version.
Sensitivity comparisons. Simulations were performed to measure the sensitivity of detecting introduced UPD events from SNP and exome data, ranging in size from 1 Mb to chromosomal.
 CiteULike
 Delicious
 Digg
Digg Facebook
 Google+
 Reddit
 Twitter
