
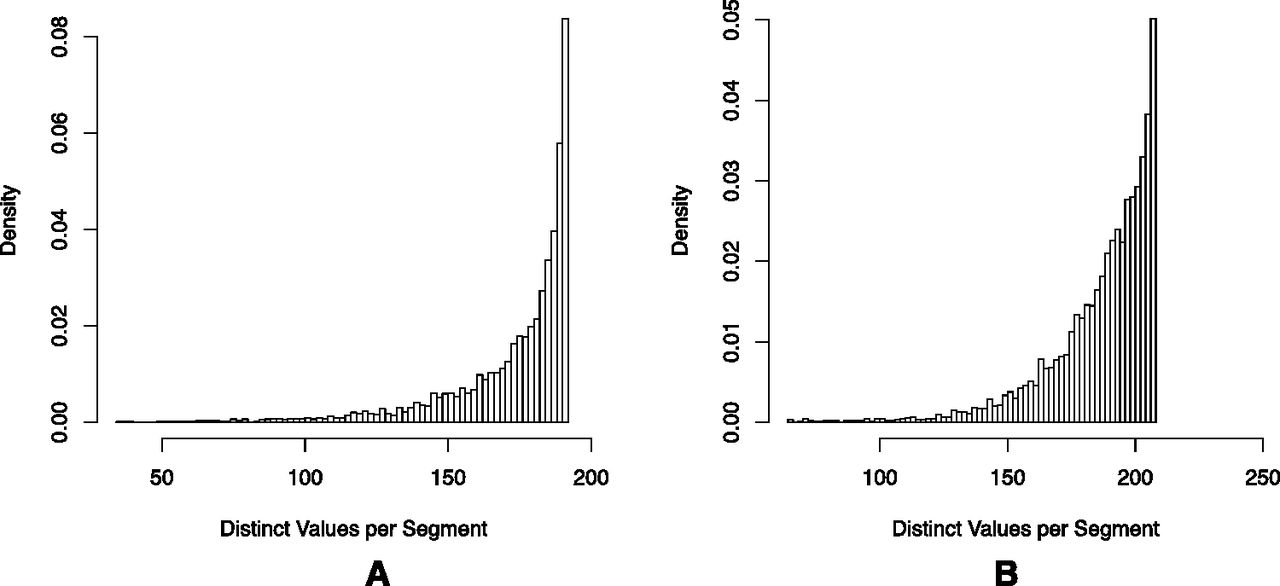
Figure 8.
Histogram of the number of different values per segment in population for unrelated individuals. We consider the 96 parents in the CEU trios and the 104 parents in the YRI trios. For each segment, we count the number of different values within a segment. The maximum possible is twice the number of individuals (192 in CEU and 208 in YRI) in the case in which each individual has a different value on each chromosome. The histograms show that the vast majority of segment values differ between unrelated individuals. (A) CEU (HapMap). (B) YRI (HapMap).


