
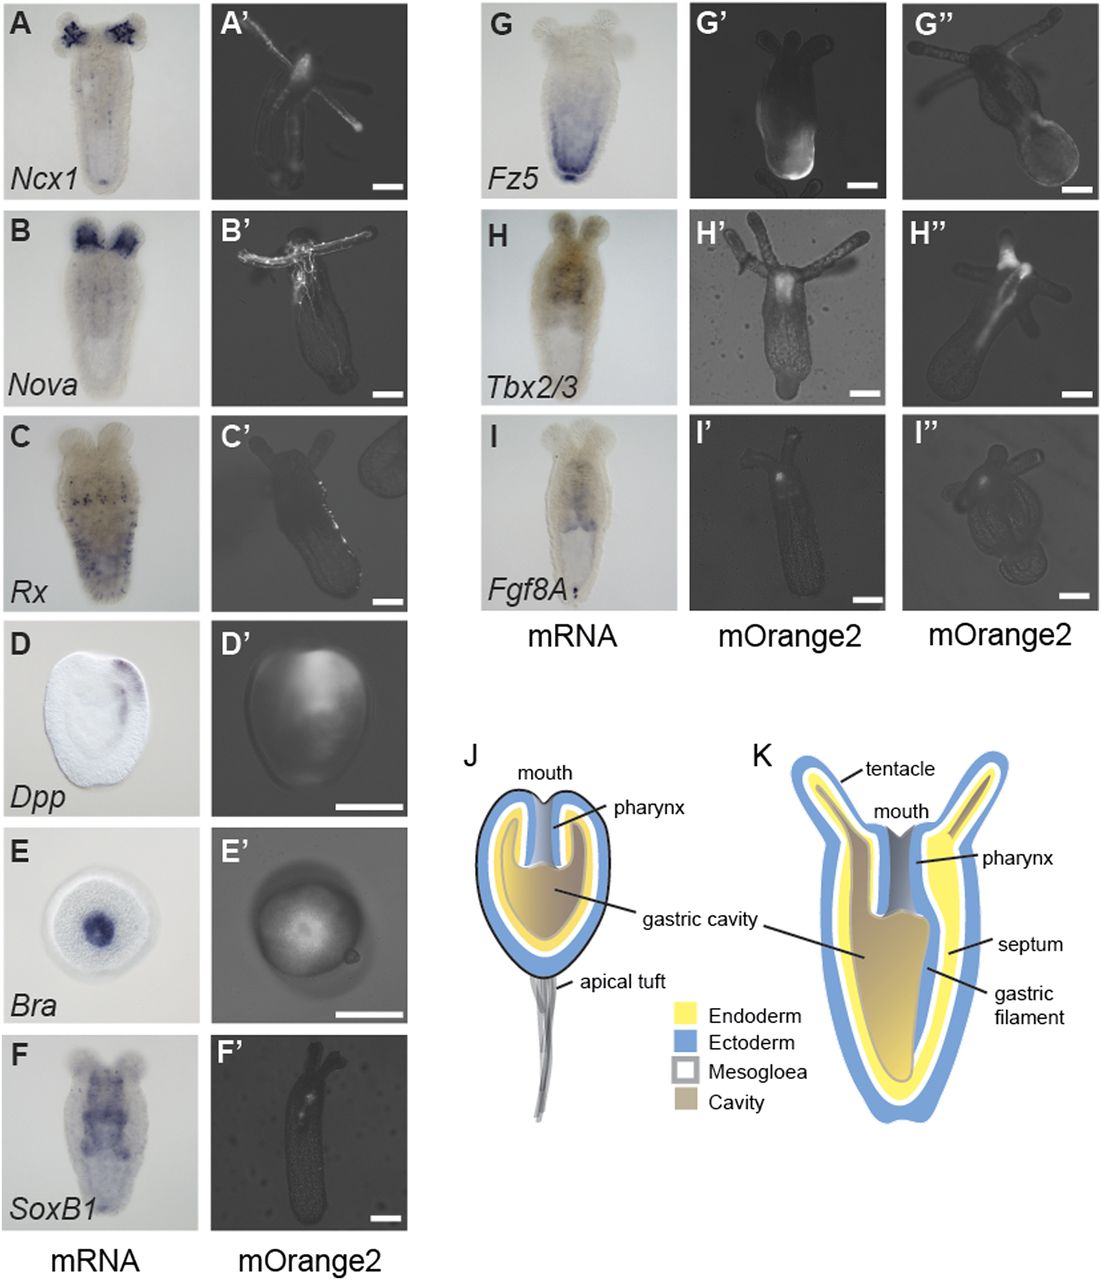
Predicted enhancer elements activate transcription in vivo. (A–I) Whole-mount in situ hybridizations of Nematostella embryos and primary polyps. (A′–I′) Fluorescent mOrange2 signal of live embryos or primary polyps injected with a construct where a predicted enhancer region of the indicated Nematostella gene was driving mOrange2 expression. (G″–I″) Fluorescent mOrange2 signal of live primary polyps injected with a construct where a second predicted enhancer region (different from the region in G′–I′) of the indicated Nematostella gene was driving mOrange2 expression. The Nematostella gene names are indicated inside the in situ hybridization pictures (Nv in the beginning of the gene name was omitted due to space constraints). The white scale bars represent 100 µm. All pictures were taken at the primary polyp stage (>8 d post-fertilization; lateral view) except D and E, which depict planula larvae (lateral view: D,D′; oral view: E,E′). (J,K) Schematic representation of a Nematostella planula larva (J) and primary polyp (K).


