
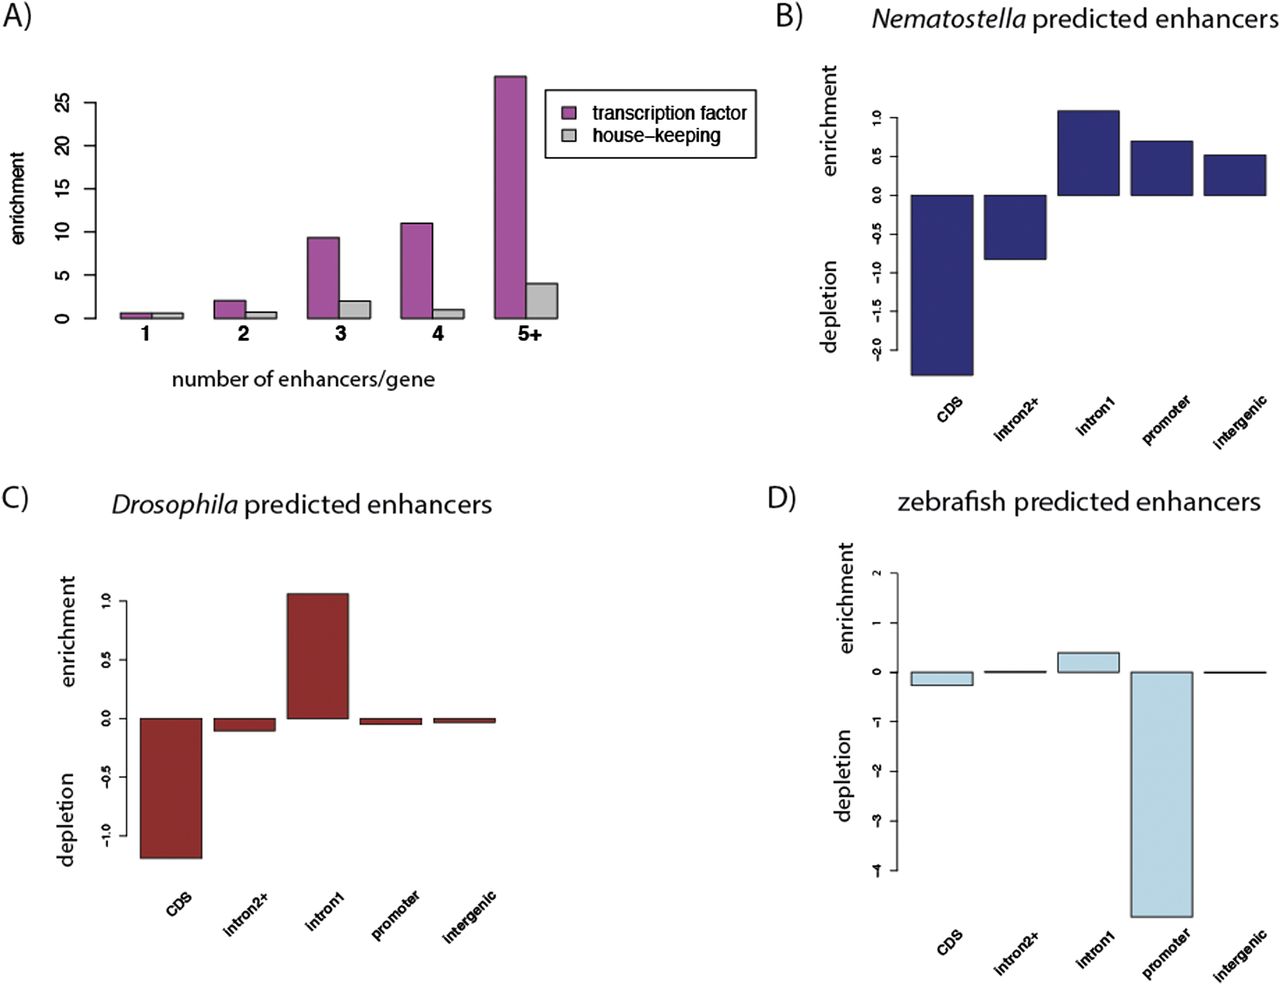
Similar genomic distribution of predicted enhancers in different eumetazoans. (A) The number of genes associated with 1, 2, 3, 4, and 5 or more predicted enhancers in Nematostella is plotted for genes encoding transcription factors (pink) and housekeeping genes (gray). The counts of genes with a given number of predicted enhancers have been normalized to the counts of genes associated with a given number of shuffled predicted enhancers. (B–D) Distribution of predicted enhancer regions normalized to shuffled predicted enhancers across genomic annotations in Nematostella (B), Drosophila (C), and zebrafish (D). Positive numbers indicate enrichment, and negative numbers indicate depletion of predicted enhancers in a certain genomic region compared with the random expectation. Promoter regions are defined from the TSS to 1 kb upstream of the TSS.


