
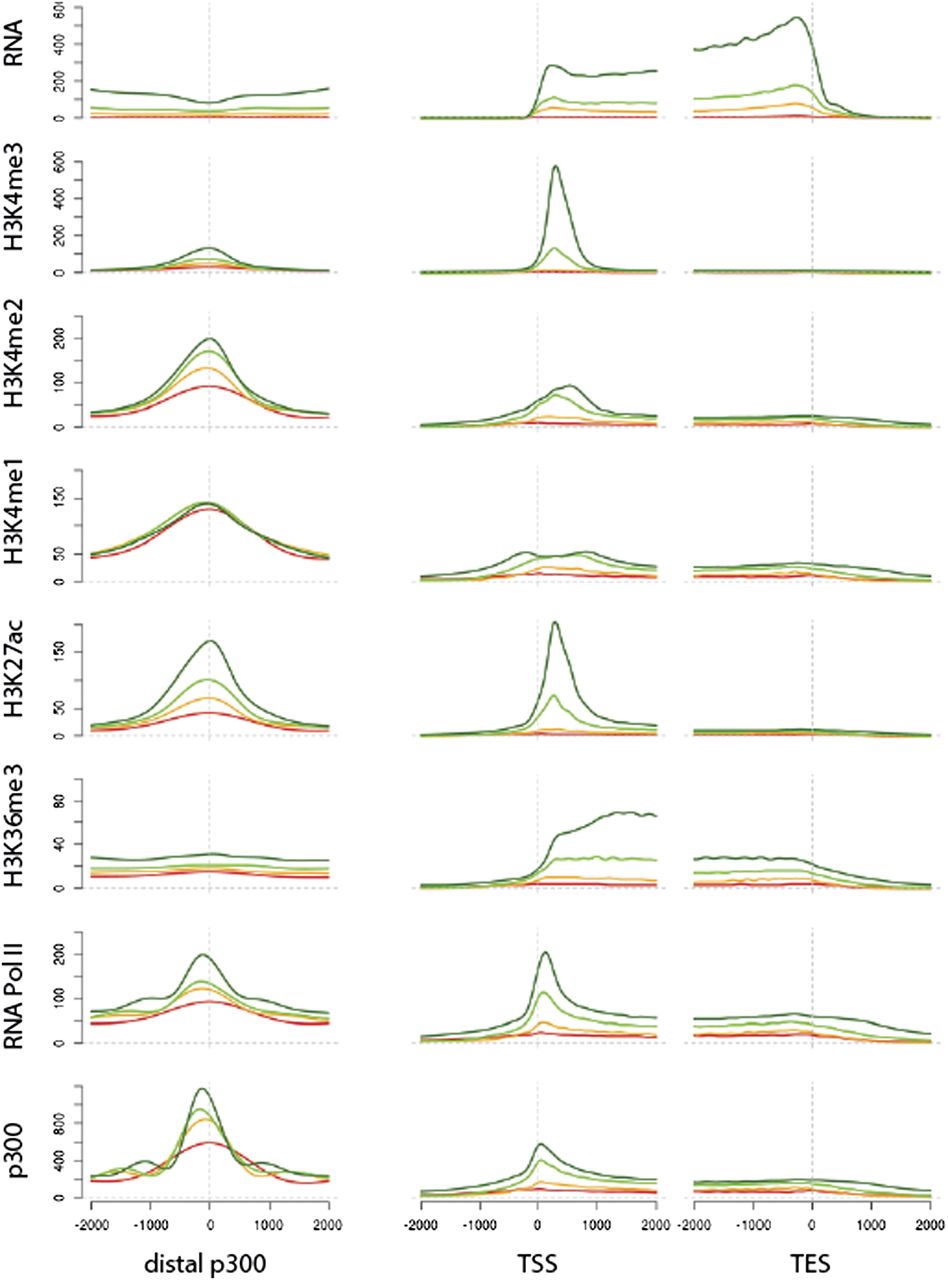
Enhancer-related chromatin modifications are associated with distal p300 peaks. Distribution of chromatin marks, RNA polymerase II, and p300 across distal p300 peaks and genes. Planula p300 peaks that do not overlap with TSSs were aligned relative to their peak summit (left plots), and genes were aligned relative to their annotated transcription start (middle plots) and end (right plots). The x-axis in each plot represents the position within the gene relative to peak summits, transcription start sites, and 3′ ends. The y-axis in each plot represents the relative enrichment for epigenomic variables such as several histone modifications in the planula stage. (Red line) Nonexpressed genes (FPKM <1.5). (Orange line) Lowly expressed genes. (Green line) Medium expressed genes. (Dark green line) Highly expressed genes. (Expressed genes) FPKM >2. The expressed genes were divided into three bins of an equal number of genes according to their FPKM values.


