
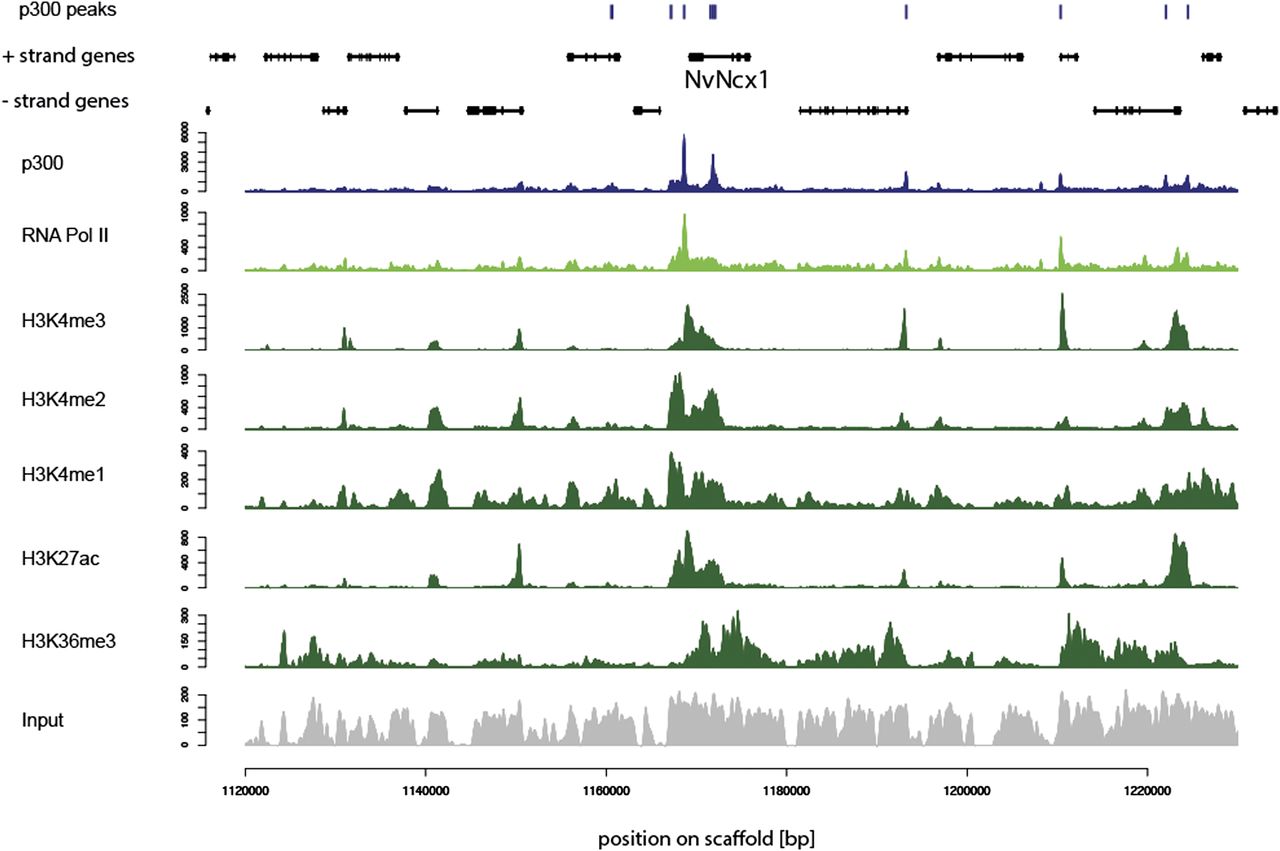
Figure 2.
Many p300 peaks overlap with sites of open chromatin. Region surrounding the NvNcx1 gene showing the distribution of p300 peaks (top, blue), gene models (black), p300 (blue), RNA Pol II (light green), several histone modifications (dark green), and input. (x-axis) Position on the scaffold; (y-axis) number of reads. The data are derived from planula larvae.


