
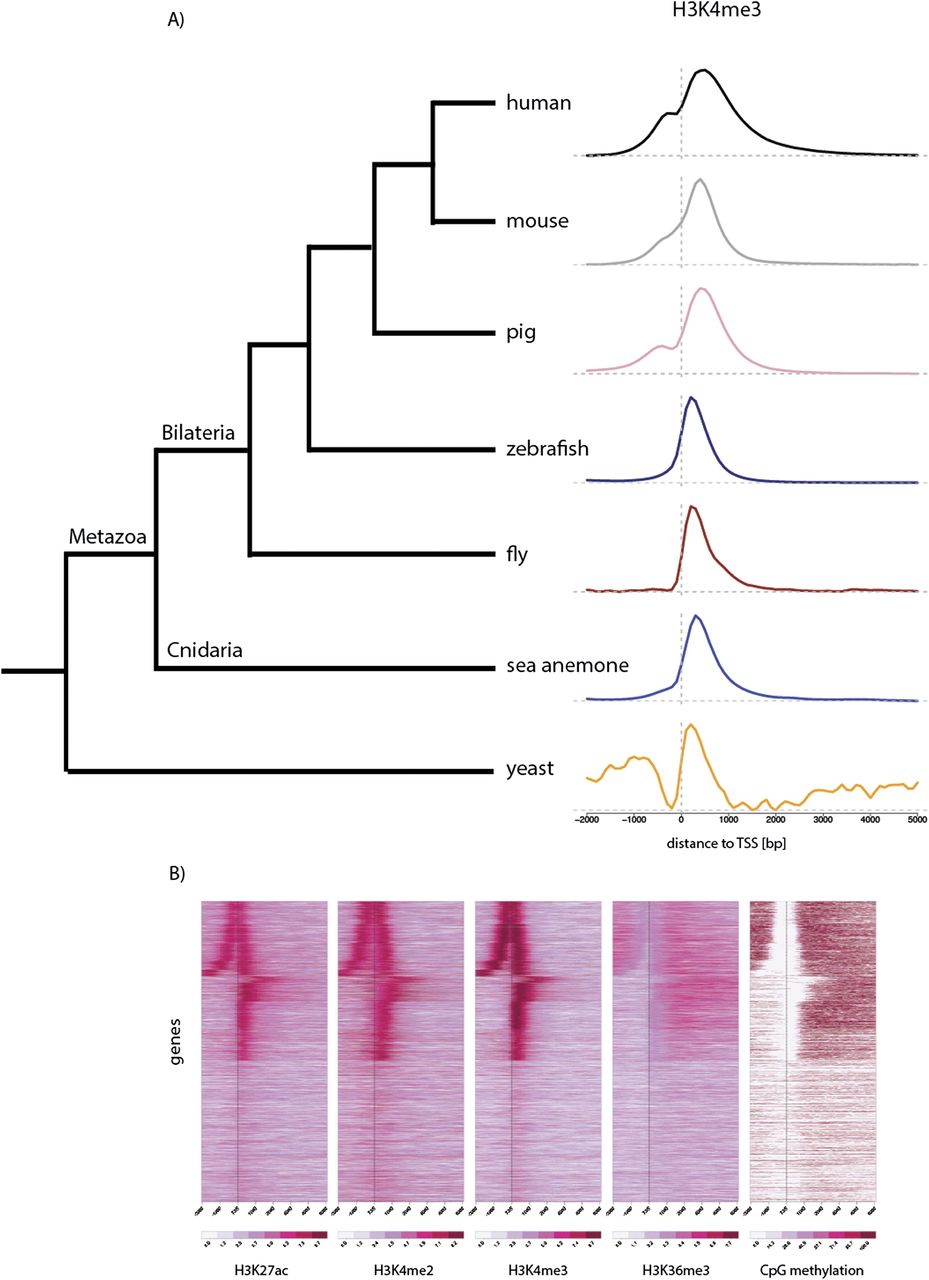
Conserved distribution of chromatin marks across genes. (A) The distribution of H3K4me3 ChIP-seq reads (y-axis) is shown around genes of different species; human (The ENCODE Project Consortium 2012), mouse (Xiao et al. 2012), pig (Xiao et al. 2012), fish (Bogdanovic et al. 2012), fly (Bonn et al. 2012), sea anemone (adult female polyps), and yeast (Maltby et al. 2012) aligned at their TSSs. TSSs were obtained from Ensembl Biomart, except for Nematostella, where they are based on RNA-seq data (D Fredman, M Schwaiger, F Rentzsch, and U Technau, in prep.). The x-axis spans −2 kb to +5 kb around TSSs. Genes with TSSs closer than 2 kb (yeast: 1 kb) to each other and shorter than 5 kb (yeast: 2 kb) were excluded from the analysis. (B) Heatmaps of histone modifications and CpG methylation (Zemach et al. 2010) in adult female Nematostella polyps around genes aligned at their TSSs, as in A. Each line of the heatmap represents a single gene (y-axis); only nonoverlapping genes longer than 5 kb were plotted. The colors indicate the number of reads on a log-scale (histone modifications) or the average percentage of CpG methylation. Note that many genes are transcribed in the opposite direction from nearby TSSs.


