
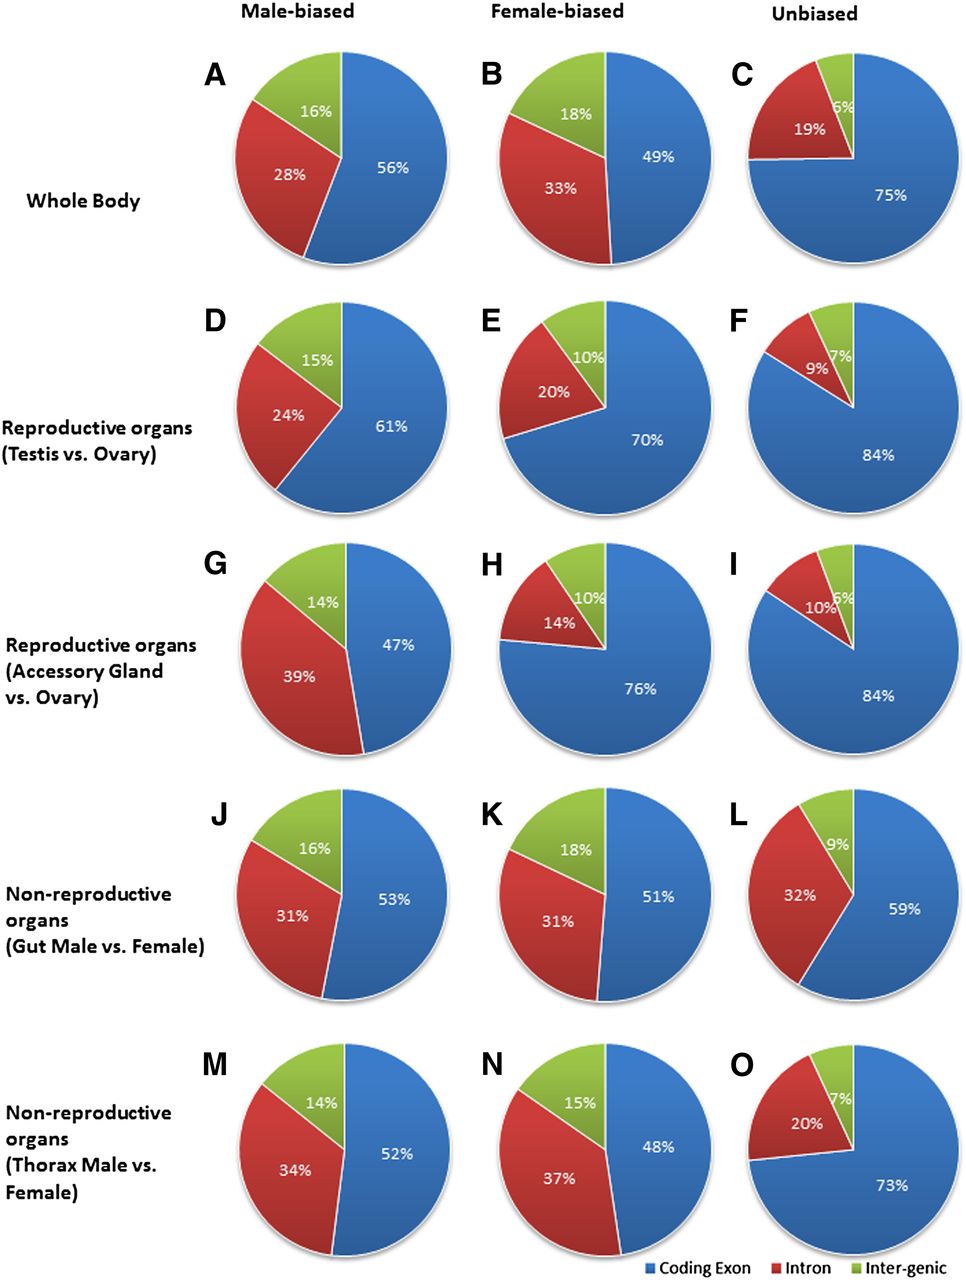
Figure 1.
Genomic distribution of sex-biased transfrags. Expression profiling was done with Affymetrix whole-genome tiling arrays. Exon/intron/intergenic annotations were retrieved from FlyBase (version 5.46). Rows represent comparisons of male and female whole body RNA (A–C), testis versus ovary (D–F), accessory gland versus ovary (G–I), male versus female gut (J–L), and male versus female thorax (M–O). Columns represent male-biased (A,D,G,J,M), female-biased (B,E,H,K,N), and non-sex-biased expression (C,F,I,L,O).


