
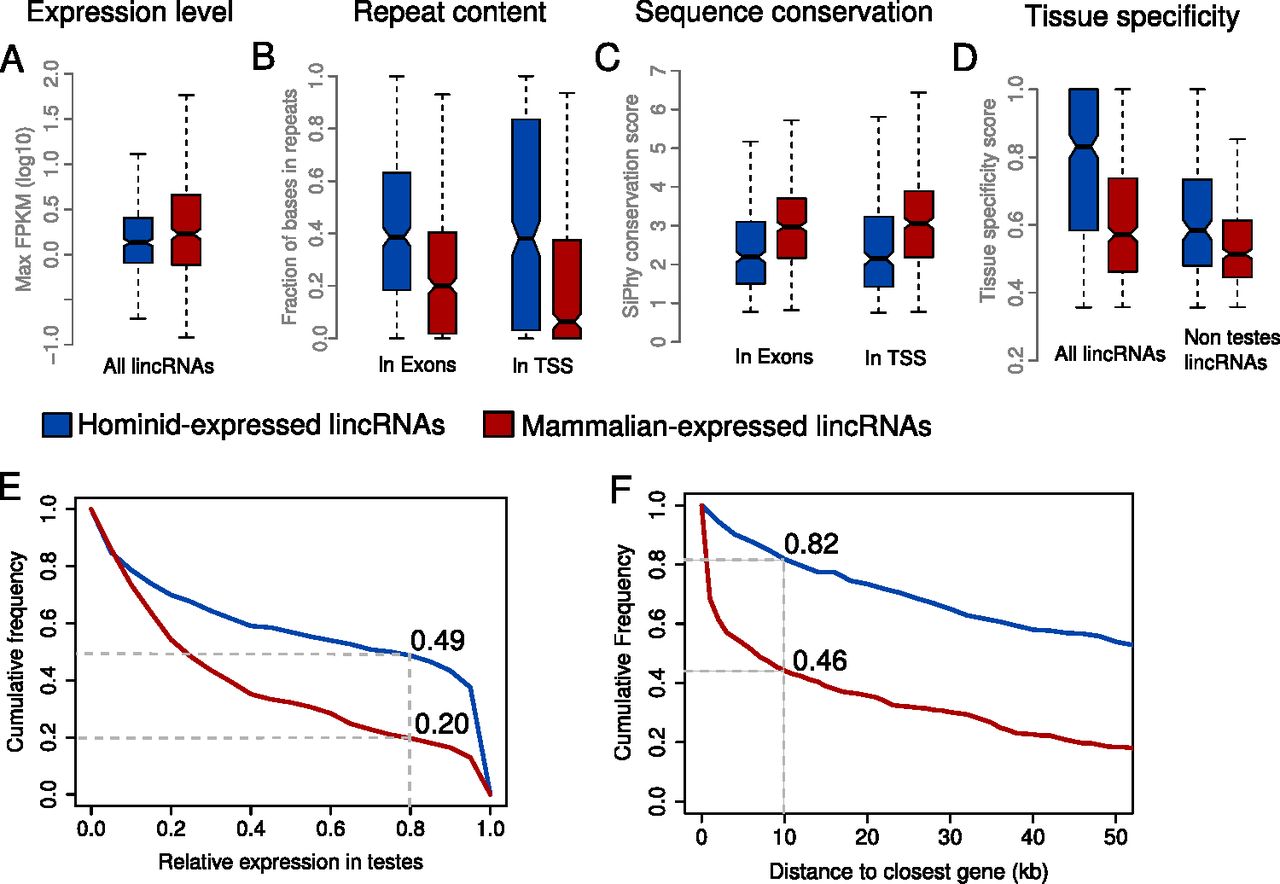
Differences between hominid-specific lincRNAs and lincRNAs conserved across mammals. Distributions are shown as box plots indicating the first quartile, median, and third quartile. Whiskers represent the range of the data without outliers. (A) Normalized expression level in human. The highest expression in all tissues is shown. (B) Repeat content. The fraction of repeat-masked bases in the exons (union over all isoforms) of a lincRNA locus and in the putative transcription start site (window 350 upstream and 150 around the annotated transcript start) is shown. (C) Sequence conservation as measured by SiPhy for exons and putative transcription start site (Methods). (D) Tissue specificity score (Methods). (Left) All lincRNAs of both sets are considered. (Right) lincRNAs that have a relative expression level higher than 0.8 in testis were removed. (E) Distribution of relative expression in testis (Methods). (F) Cumulative distribution of the distances of human lincRNA loci to the closest annotated (Ensembl version 64) protein-coding gene.


