
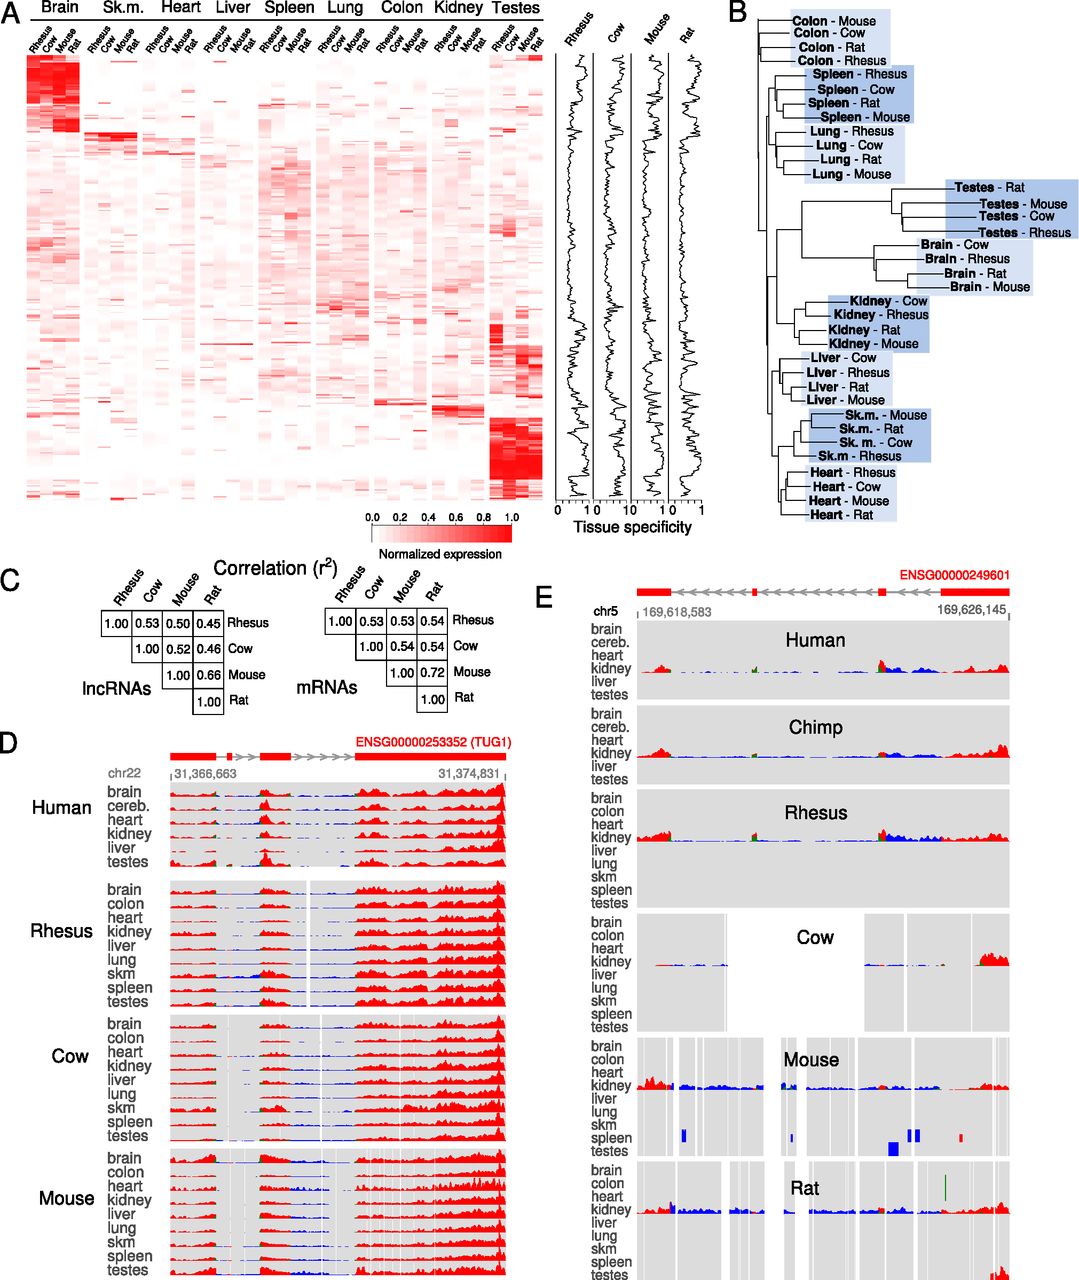
Tissue specificity of lincRNAs across species. (A) Heatmap of normalized expression values (see Methods) for all tissues and species. Data is only shown for lincRNAs that have significant (P < 0.1; Methods) expression in rhesus, cow, mouse, and rat. On the right of the heatmap, a normalized tissue specificity score is shown for all species (Methods). (B) Neighbor-joining tree generated from the similarity matrix of expression values across all lincRNAs in all tissues and species. (C) Correlation of expression between species across all tissues for lincRNAs and mRNAs. D and E show examples of a lincRNA ubiquitously expressed in all tissues and a lincRNA highly restricted to kidney, respectively. The same conventions as in Figure 2 are used.


