
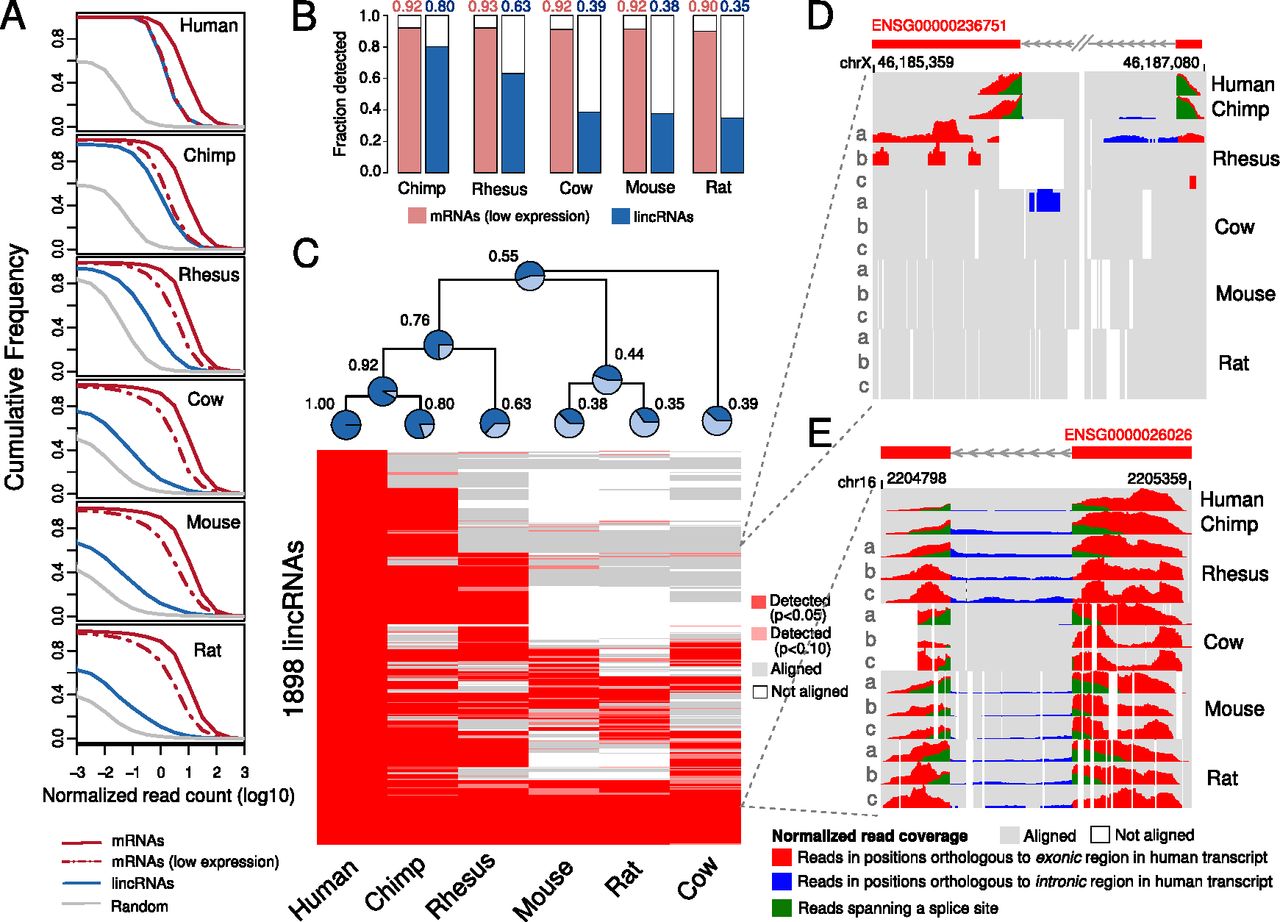
Conservation of lincRNA expression across placental mammals. (A) Cumulative distributions of normalized read counts (number of reads per million reads in the library per kb of the transcript portion that could be aligned to the other species). The maximum of this normalized count of all tissues is considered for the distribution shown. We use a floor of 10−3 whenever no reads were found in any tissue or the transcript could not be aligned. (B) Fraction of human lincRNAs that were detected in other species. A lincRNA is counted as detected if it either was expressed with an empirical P-value of P < 0.1 compared to random regions or if it is supported by conserved splice sites (Methods). In comparison, the detection rate for mRNAs with similar expression levels as the lincRNAs are shown (to be conservative in this comparison, we only used the expression P-value cutoff because mRNAs have more and better conserved splice sites). (C) Conservation patterns of individual lincRNAs. The fraction at the tips of the phylogenetic tree corresponds to the fraction of detected lincRNAs in B. The fractions for the inner nodes are estimated using a parsimony approach (Methods). D and E show the actual read patterns observed in the different species for two lincRNA examples. Read counts were normalized between 0 and 1 for each line; only positions with absolute read coverage greater than five are shown. For rhesus, cow, mouse, and rat, all three replicates are shown (indicated by a, b, c). Example D shows a lincRNA well-supported in human and chimpanzee but absent in all replicates in the more distantly related mammals. Example E shows a transcript conserved in all species also supported by all replicates.


