
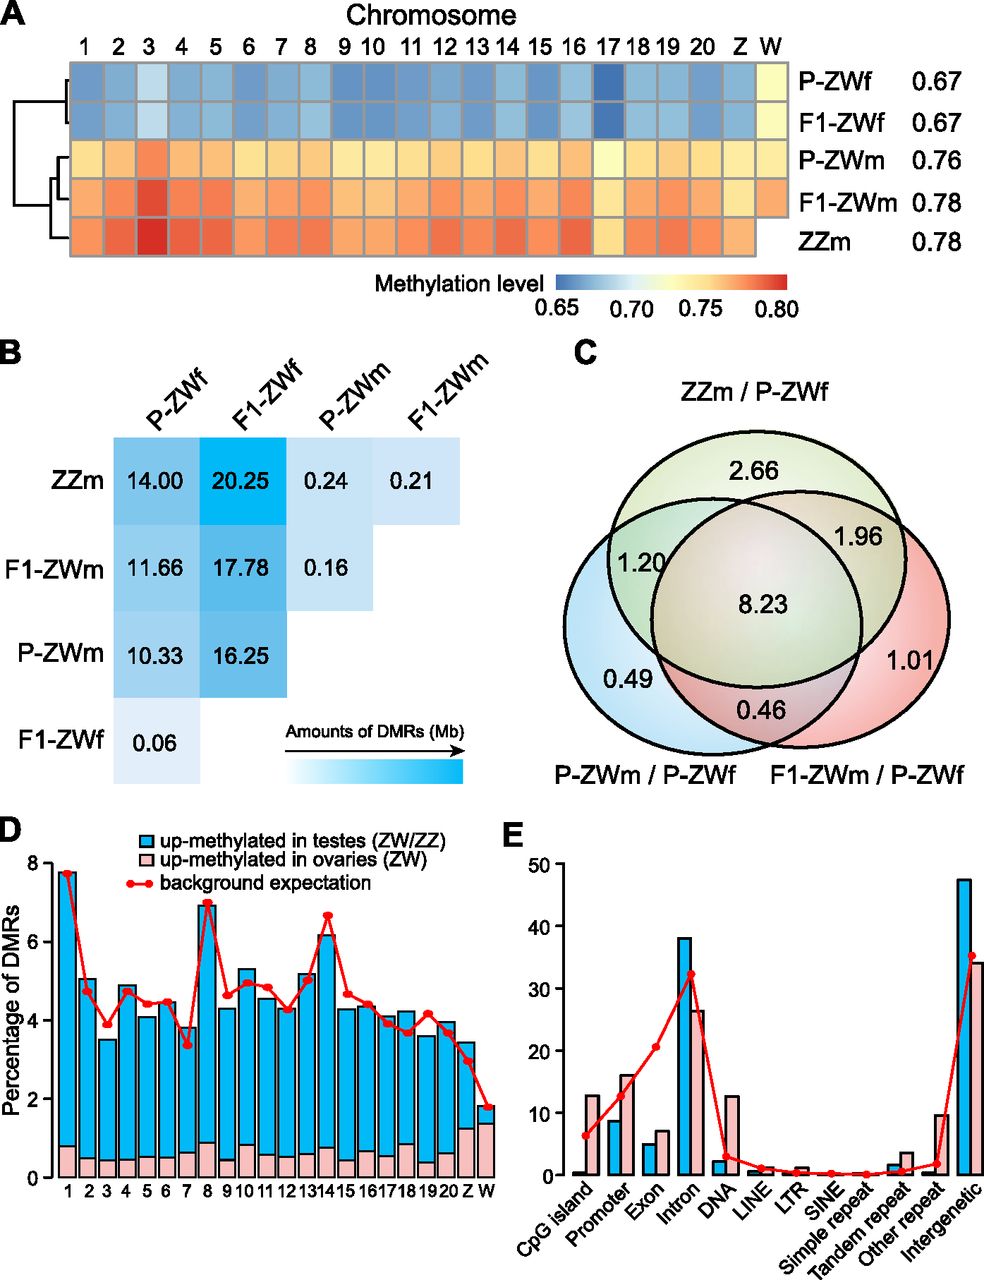
Genome-wide methylation level comparisons. (A) Methylation levels of different chromosomes. Numbers after the sample names represent methylation levels of the whole genome. Only CpGs with ≥10× coverage were used for analysis. (B) Total length (Mb) of DMRs identified in each pairwise comparison. (C) Venn diagrams for DMRs of P-ZWm/P-ZWf, F1-ZWm/P-ZWf, and ZZm/P-ZWf. Numbers represent the total length (Mb) of shared DMRs. (D) Percentage of testis/ovary DMRs on different chromosomes. Background expectation for each chromosome was calculated as the covered length (≥6× in all five samples) of each chromosome divided by the total covered length of all chromosomes. (E) Percentage of testis/ovary DMRs on different genomic elements. Background expectation for each element was calculated as the covered length of each element divided by the total covered length of the genome.


