
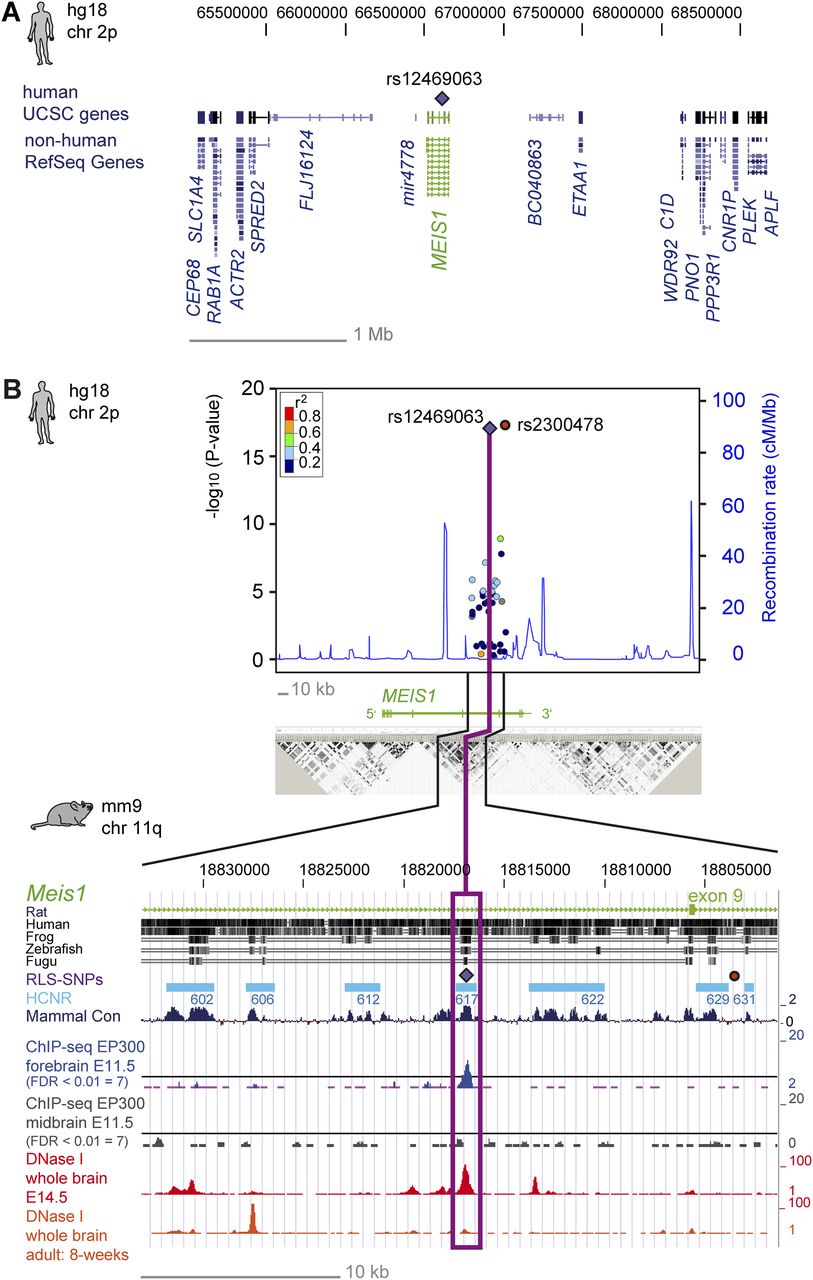
Association signals, sequence conservation, and epigenetic signatures in embryonic and adult stages of the MEIS1/Meis1 locus (A) RLS-associated locus on 2p14 with the lead SNP rs12469063 (violet diamond) and its genetic environment. (B) The x-axis represents the genomic position, referring to the hg18 genome annotation. The right-hand y-axis represents the recombination rate, and the negative log10 of the nominal P-values of all SNPs genotyped are given on the left-hand y-axis. The color-coded LD between SNPs is based on the lead SNP rs12469063 (violet diamond) as a reference. rs2300478, which lies in a nonconserved region, is depicted with a red circle. Recombination rate and r2 values were estimated with the CEU population from HapMap II (release 22). The LD block below is based on HapMap data, measured in r2 and visualized with Haploview. Highlighting refers to the magnitude of pairwise LD, with a white-to-black shading indicating lower to higher LD values. The lower part of Figure 1B uses mouse genome annotation mm9 and lists from top to bottom: (1) conservation between the mouse genome and the genome of the rat, human, frog, zebrafish, and Fugu; (2) corresponding localization of the human RLS-SNPs rs12469063 (violet diamond) and rs2300478 (red circle); (3) seven analyzed HCNRs in turquoise boxes; (4) the conservation in mammals (dark blue); (5) DNA binding of EP300 (ChIP-seq) in E11.5 forebrain (blue) and midbrain (gray); and (6) DNase I hypersensitivity in whole brain of E14.5 embryos and adult mice (red and orange peaks, respectively).


