
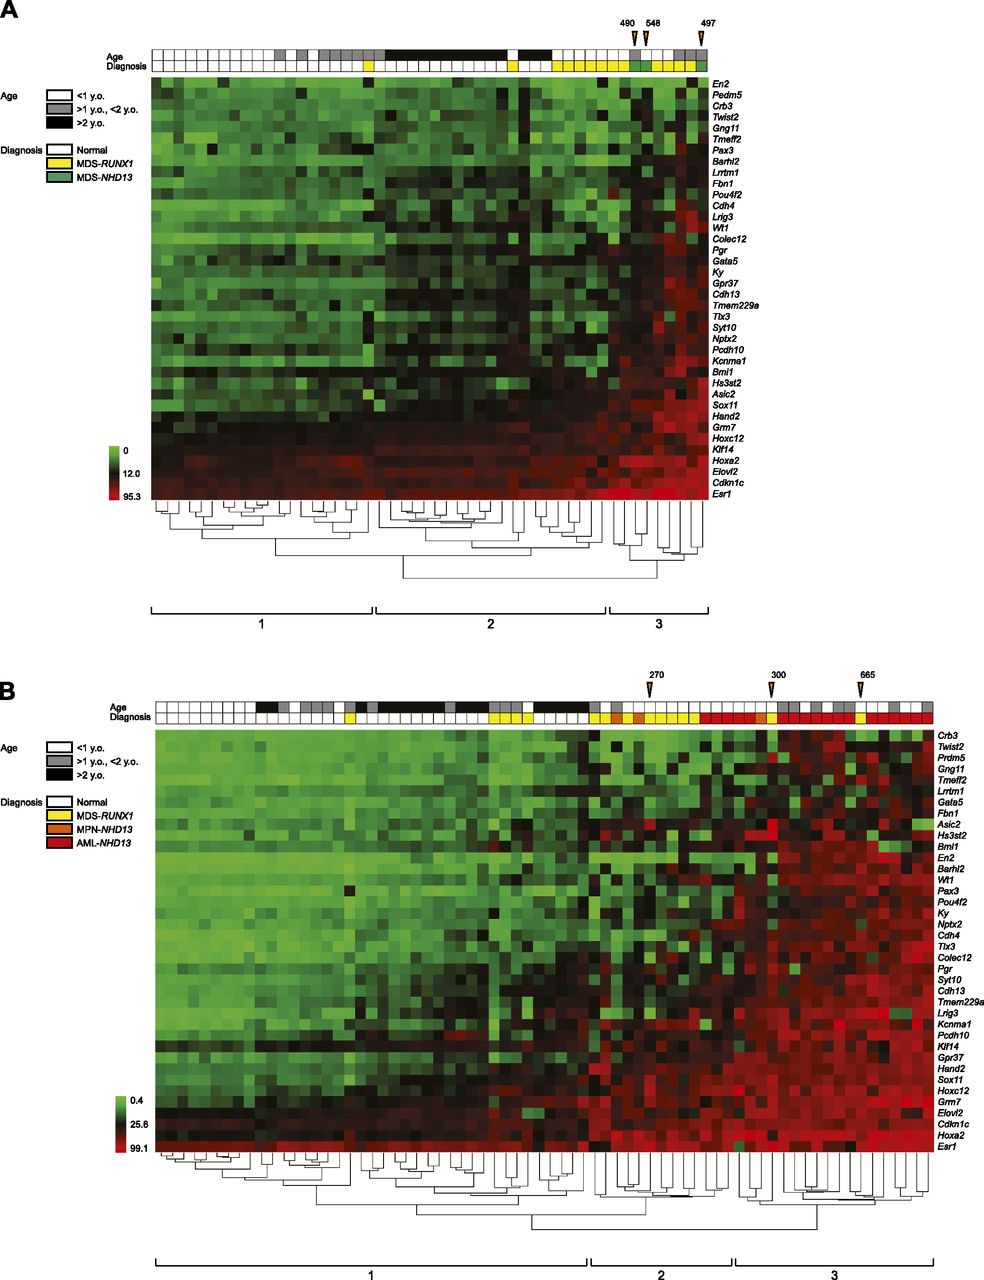
Figure 3.
Hierarchical clustering analysis of methylation markers in mouse. (A) Hierarchical clustering analysis in bone marrow. Green to red cells indicate the range of methylation percentage from 0 to 95.3. The color codes for mouse strain, tissues, age, and diagnosis are listed on the left side. Orange arrowheads indicate samples for MCAM with number of methylated genes by MCAM. (B) Hierarchical clustering analysis in spleen.


