
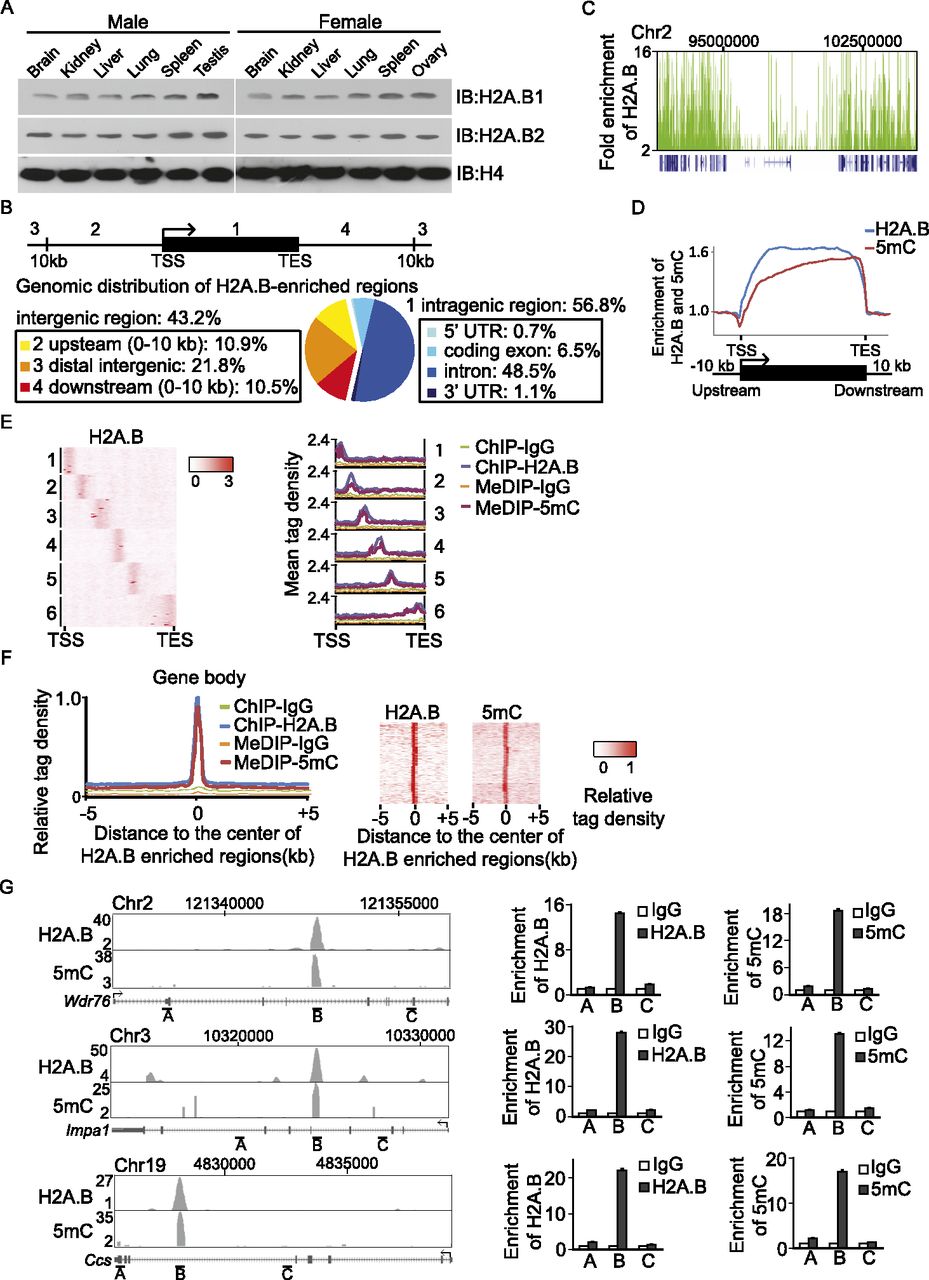
H2A.B is associated with 5mC in the gene body. (A) H2A.B is ubiquitously expressed in major organs. Chromatin fractions from different mouse tissues are subjected to Western blotting with anti-H2A.B1 and H2A.B2 antibodies. Anti-histone H4 is used as a protein loading control. (B) Genomic distribution of H2A.B in different regions is summarized in a pie chart. (TSS) transcription start site, (TES) transcription end site. (C) A snapshot of the distribution of H2A.B (green) in the region of chr2: 90,353,915–106,163,465 in mouse ES cells. Gene structure is indicated in blue at the bottom of the plot. (X-axis) The indicated genomic region; (y-axis) the fold enrichment of H2A.B compared to the irrelevant IgG control. (D) Relative enrichment of H2A.B and 5mC within 10 kb upstream of and downstream from the gene body in mouse ES cells. (X-axis) Relative gene position; (y-axis) relative fold enrichment. (E) Heat map represents the clusters of H2A.B enrichment in gene bodies in mouse ES cells. The tag density of H2A.B is calculated and subjected to k-means clustering. Six major clusters were indicated (left panel). Mean tag density of H2A.B and 5mC are plotted in each cluster (right panel). (Y-axes) Mean tag density. Irrelevant IgG was used as the control in ChIP-seq and MeDIP-seq. (F) Normalized tag density of 5mC in H2A.B-enriched gene body region. The detailed analyses are included in the Methods section. (G) Representative regions show the overlap between H2A.B and 5mC. In the left panels, the x-axes indicate the genomic regions. The y-axes represent the fold enrichment of H2A.B and 5mC. Three different regions in each gene are examined by ChIP-qPCR and MeDIP-qPCR to confirm the ChIP-seq and MeDIP-seq analyses. Data are presented as mean ± SEM (n = 3).


