
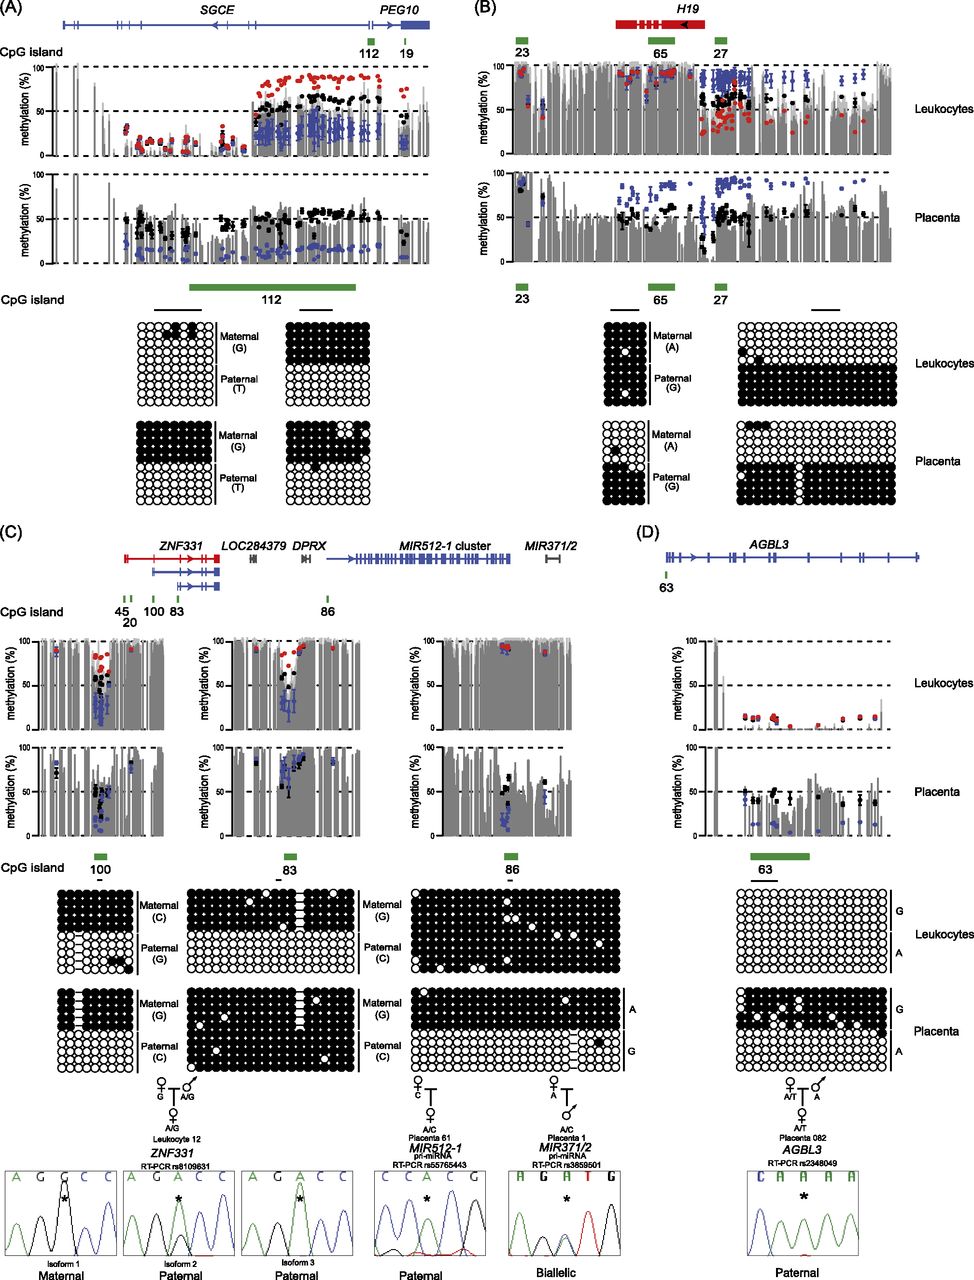
The methylation profiles of imprinted loci in placenta compared to somatic tissues. The placenta- and leukocyte-derived WGBS and Infinium array profiles at the (A) PEG10 and (B) H19 loci. Infinium methylation values for normal leukocytes (black dots), with values for the genome-wide pUPD (blue) and mUPD (red) superimposed on the leukocyte WGBS track. Similarly, Infinium methylation values for normal placenta (black dots) and hydatidiform mole (blue dots) are overlaid on the placental WGBS track. The error bars associated with the Infinium array probes represent the standard deviation of multiple biological samples. Bisulfite PCR analysis was used to confirm the tissue-specific methylation profiles. (C) Complex tissue-specific allelic methylation and expression patterns at the ZNF331-MIR512 cluster locus on chromosome 19. The ZNF331 sequence traces represent the RT-PCR products from leukocytes, whereas both the MIR512-1 cluster and MIR371/2 are from placenta. (D) A placental-specific imprinted DMR identified using the placenta-derived WGBS and Infinium array data sets. The methylation profiles were confirmed using standard bisulfite PCR on heterozygous DNA samples with allelic RT-PCR performed on placental biopsies. The results confirm that the region of maternal methylation overlapping the AGBL3 promoter dictates paternal expression of this gene in placenta.


