
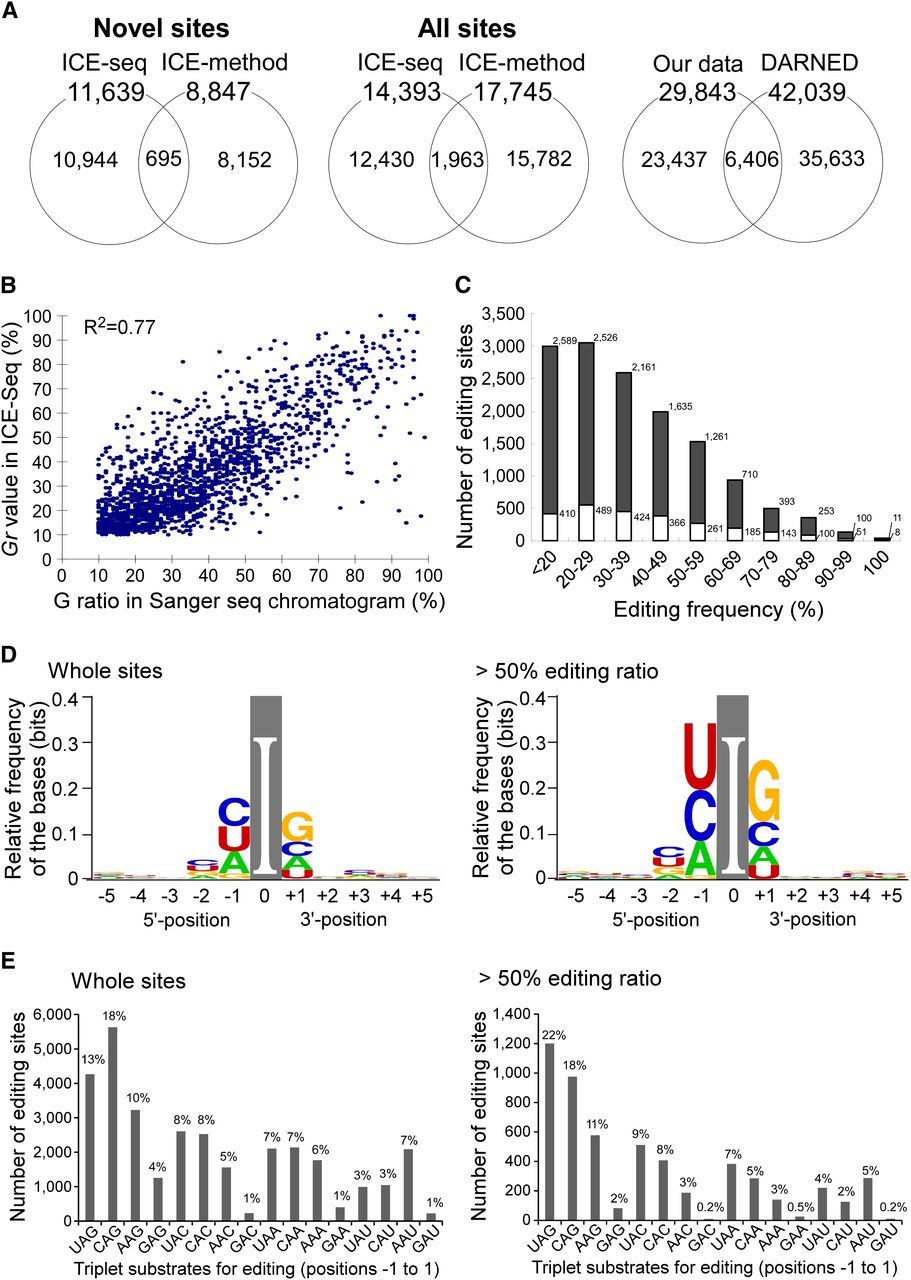
Statistical features of A-to-I editing sites detected by ICE-seq. (A) Venn diagrams show the number of novel editing sites detected by ICE-seq and the ICE method in this study (left panel), both from known and novel editing sites detected in this study (middle panel), and the number of editing sites detected by us and known/predicted sites deposited in DARNED (right panel). (B) Plot of the Gr value versus the G ratio at each editing site. The coefficient of determination (R2) is 0.77. (C) Editing frequency distribution of the sites detected by ICE-seq. The editing frequency of each site was calculated from the Gr value. The numbers of editing sites at each template ratio are compiled in the histogram. Gray and white boxes represent novel and known/predicted sites, respectively. (D) Base preference around the editing site presented by WebLogo using the full ICE-seq data set (left) and sites with >50% editing frequency (right). (E) Triplet preference of editing. Statistics of triplet sequences centered on the edited A were analyzed using the full ICE-seq data set (left) and sites with >50% editing frequency (right).


