
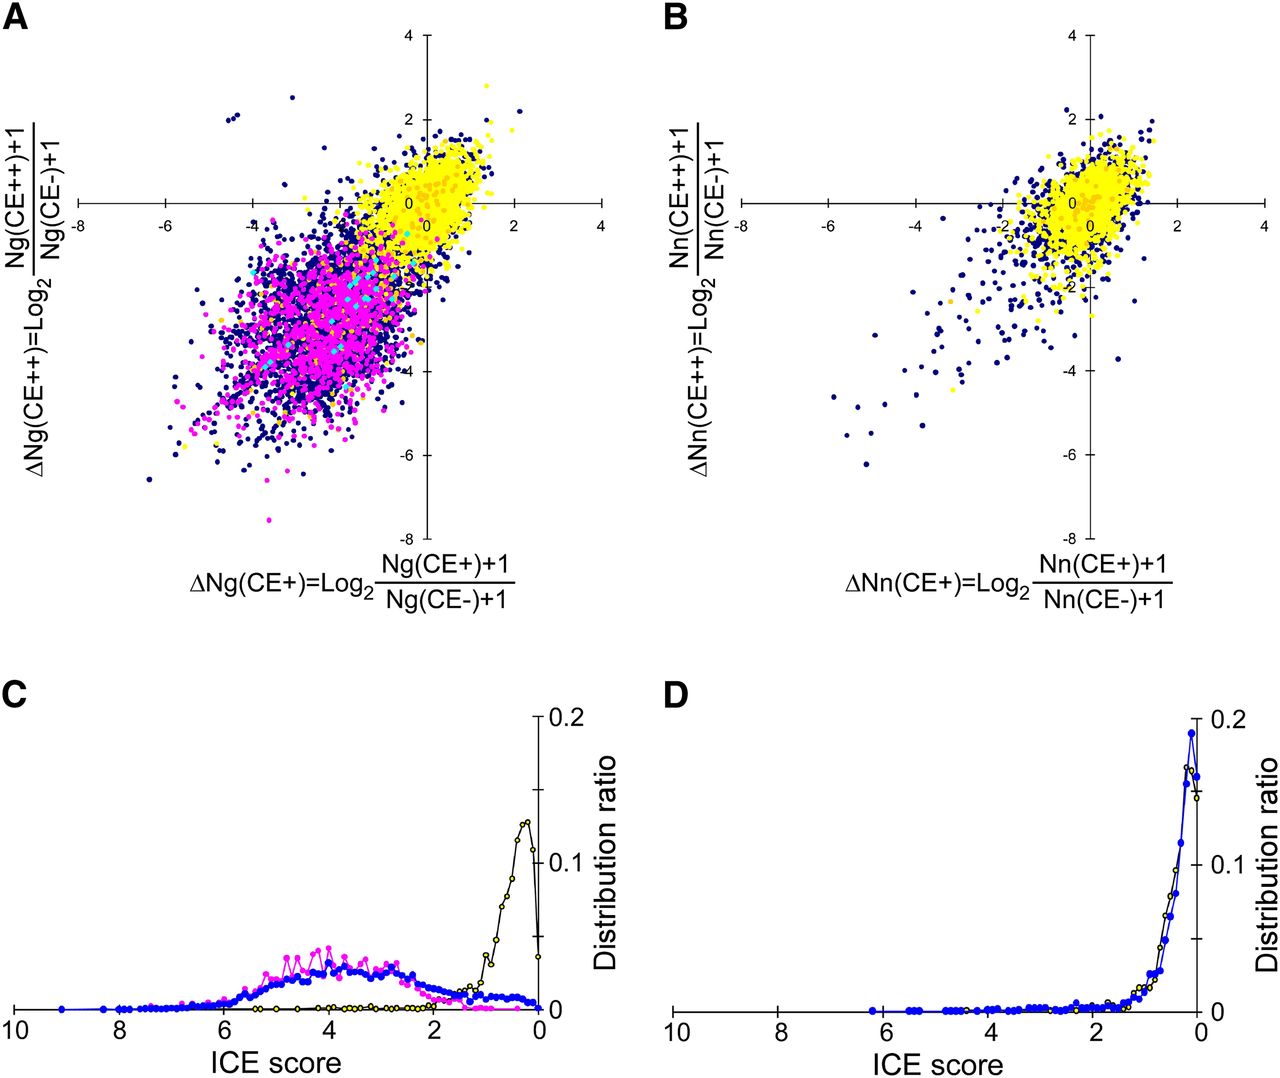
Separation of A-to-I editing sites from false-positive sites and SNPs. (A) Scatter plot of ΔNg(CE+) versus ΔNg(CE++). The 40 known editing sites in CDS (Supplemental Table S3) and 1963 editing sites validated by the ICE method in non-CDS (Supplemental Table S4) are indicated by light blue and magenta points, respectively. cSNPs and gSNPs are indicated by yellow and orange points, respectively. Dark blue points are nonannotated A-to-G sites. (B) Scatter plot of ΔNn(CE+) versus ΔNn(CE++). cSNPs and gSNPs are shown as yellow and orange points, respectively. Dark blue points are nonannotated mismatched sites. (C) Histogram of the ICE scores for A-to-G sites from SNPs (yellow), known editing sites (magenta), and nonannotated sites (blue). (D) Histogram of the ICE scores for non-A-to-G sites from SNPs (yellow) and nonannotated sites (blue).


