
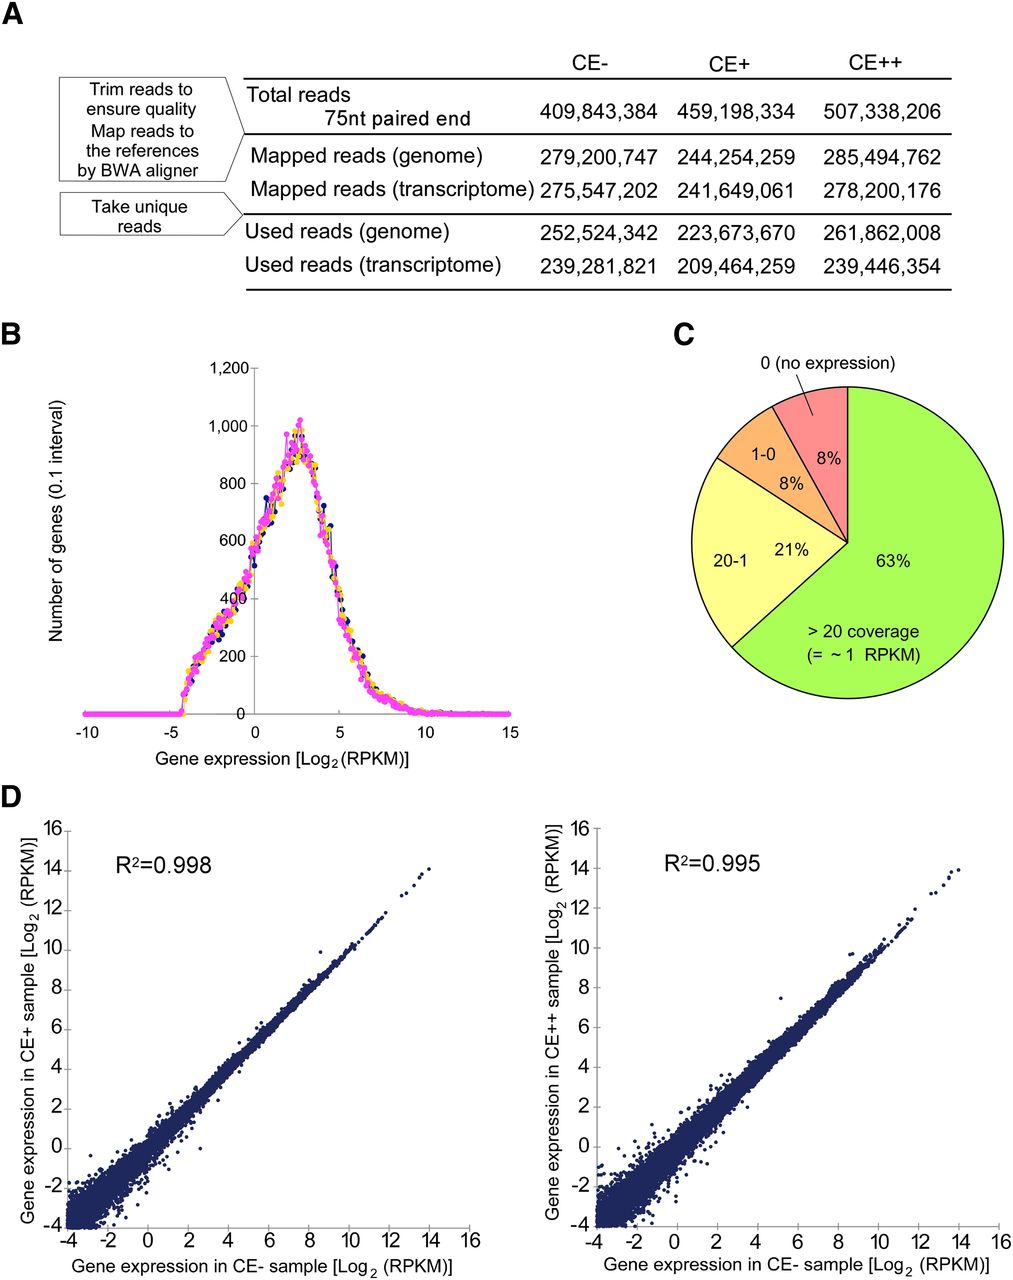
Sequence statistics of ICE-seq. (A) Numbers of mapped tags used for ICE-seq in CE−, CE+, and CE++ conditions. The reference genome and cDNA sequences used here are hg18 and the UCSC gene, respectively. (B) Distribution histogram of gene expression estimated by the read coverage. Gene expression represented by the Log2(RPKM) value for the reference transcriptome sequence is compiled at 0.1 Log2(RPKM) intervals under conditions of CE− (blue), CE+ (yellow), and CE++ (magenta). (C) Pie chart of gene expression estimated by the read coverage. A total of 63% of human genes are detected with more than 20 times coverage (∼1 RPKM). (D) Scatter plots of logarithmic RPKM values in CE− versus CE+ or CE++. Their coefficients of determination (R2) are 0.998 and 0.995, respectively.


