
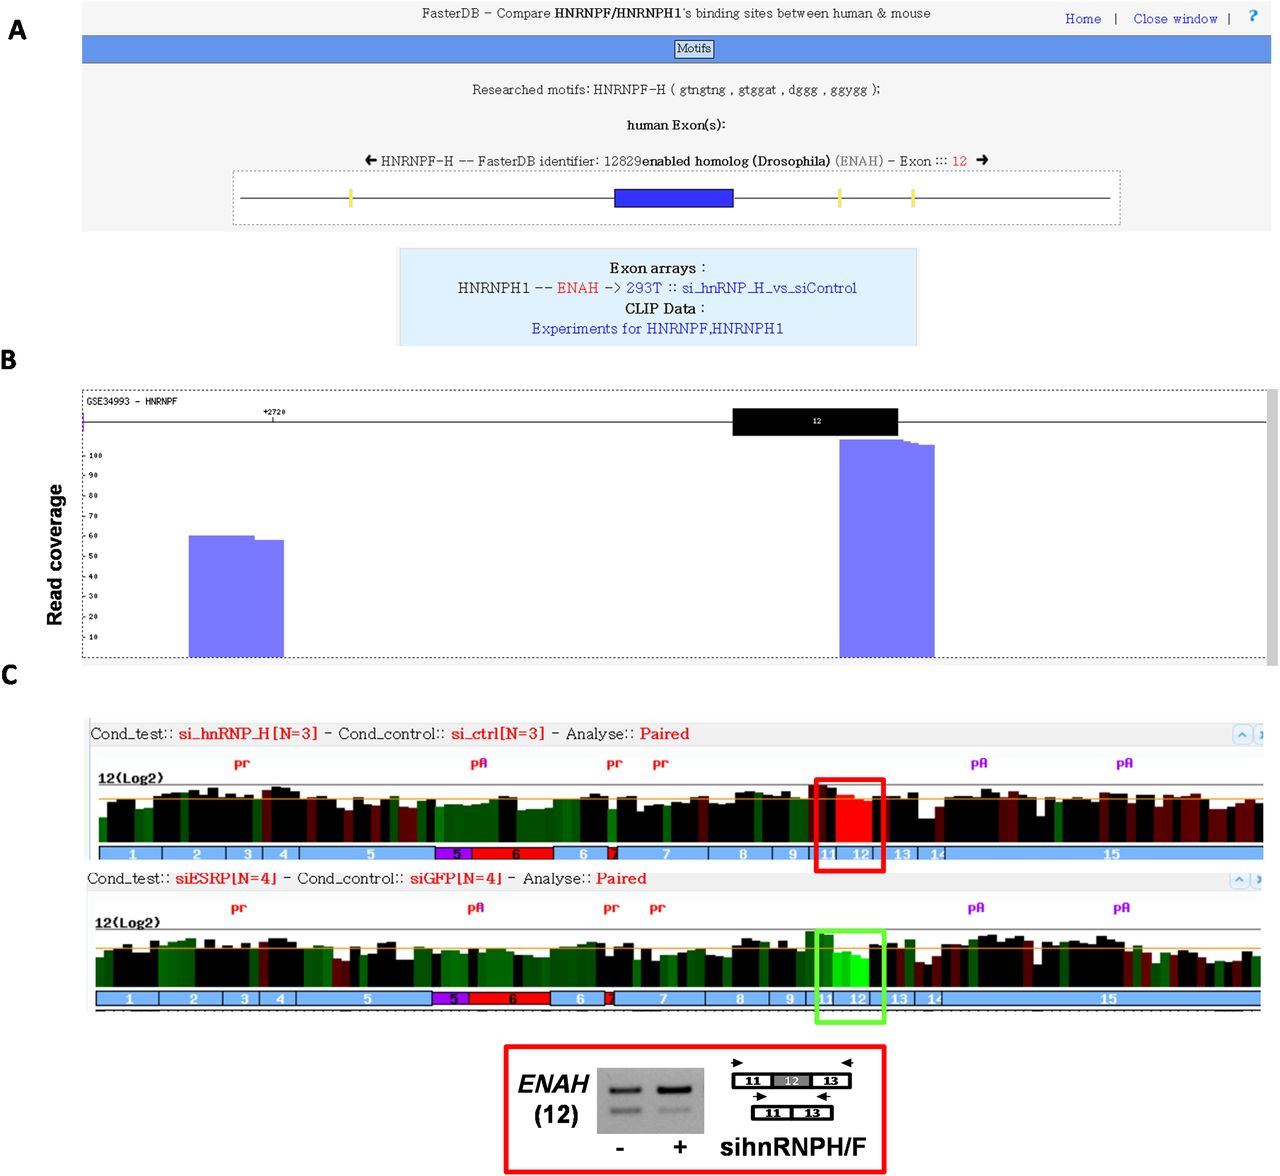
Figure 5.
Dedicated CLIP-seq data visualization web interface. (A) Localization of predicted hnRNPH/F binding motifs in the vicinity of the ENAH exon 12 and their link to splicing factor data sets. (B) Reads from a CLIP-seq experiment corresponding to hnRNPF binding sites in the vicinity of the ENAH exon 12. (C) Visualization of exon array probe intensities in hnRNPH/F- or ESRP1-depleted cells as compared to control cells. RT-PCR analysis of the ENAH exon 12 inclusion rate in hnRNPH/F-depleted or control cells.


