
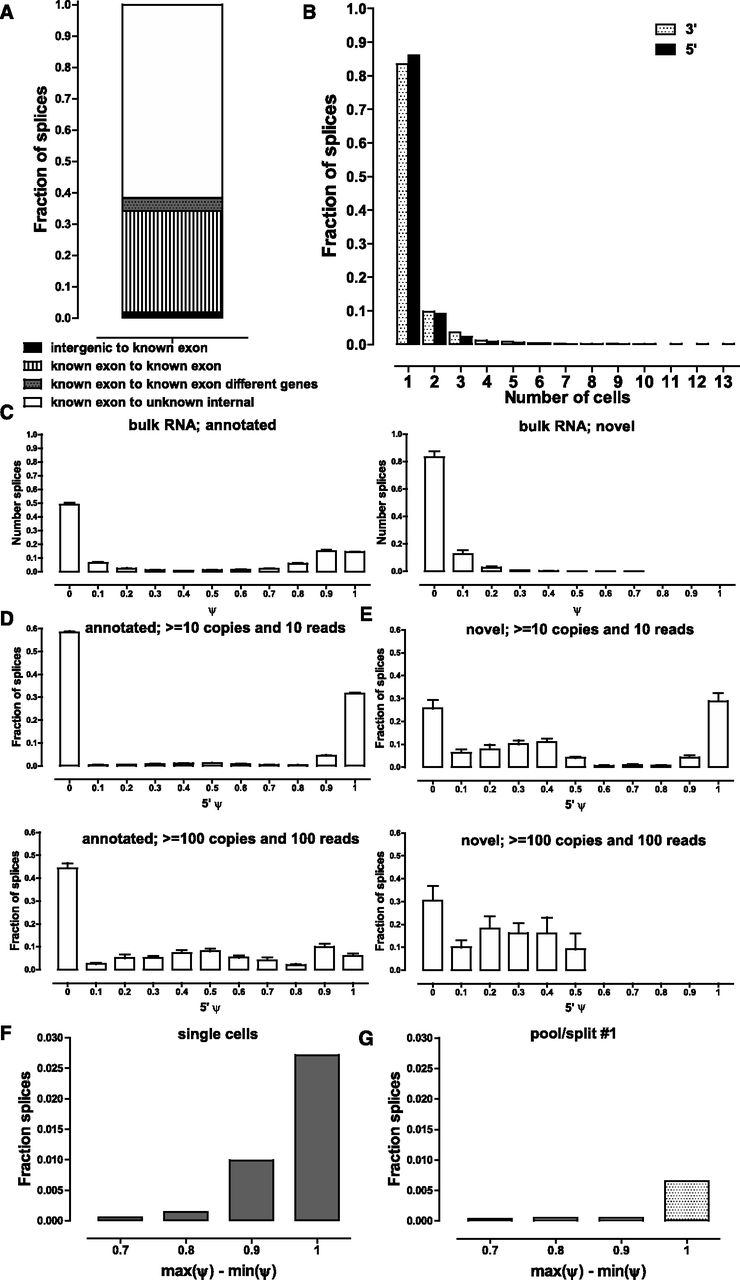
Alternative splicing at the single-cell level. (A) Classification of new junctions connecting known splice sites. (B) Frequency of detection of novel splice junctions. Novel junctions for which neither the donor nor acceptor site has been annotated were excluded for reasons described in the main text in both A and B. A threshold of 10 estimated copies and a coverage of 10 reads was applied, but results are essentially the same, independent of the thresholds used (Supplemental Fig. 40A). (C) Distribution of ψ scores in bulk RNA samples for annotated and novel splice junctions. A threshold of 15 reads combined for all splice junctions in which a donor or acceptor site participates was applied. Note that for each ψ1 score there is at least one matching ψ2 ≤ 1 − ψ1 score corresponding to the other alternative junction; in some cases, more than two alternative donor or acceptor sites exist; thus the relative height of the 0 ≤ ψ ≤ 0.1 bar. (D, upper and lower). Distribution of 5′ ψ scores for annotated splice junctions at two different detection thresholds in single-cell libraries (see Supplemental Fig. 41 for more detail). (E, upper and lower) Distribution of 5′ ψ scores for novel splice junctions at two different detection thresholds in single-cell libraries (see Supplemental Fig. 42 for more detail). (F,G) Frequency of major splice site usage switches between individual cells (F) and individual libraries in a pool/split experiment (G). Note the strong support for major splice site use switching across the collection of single cells.


