
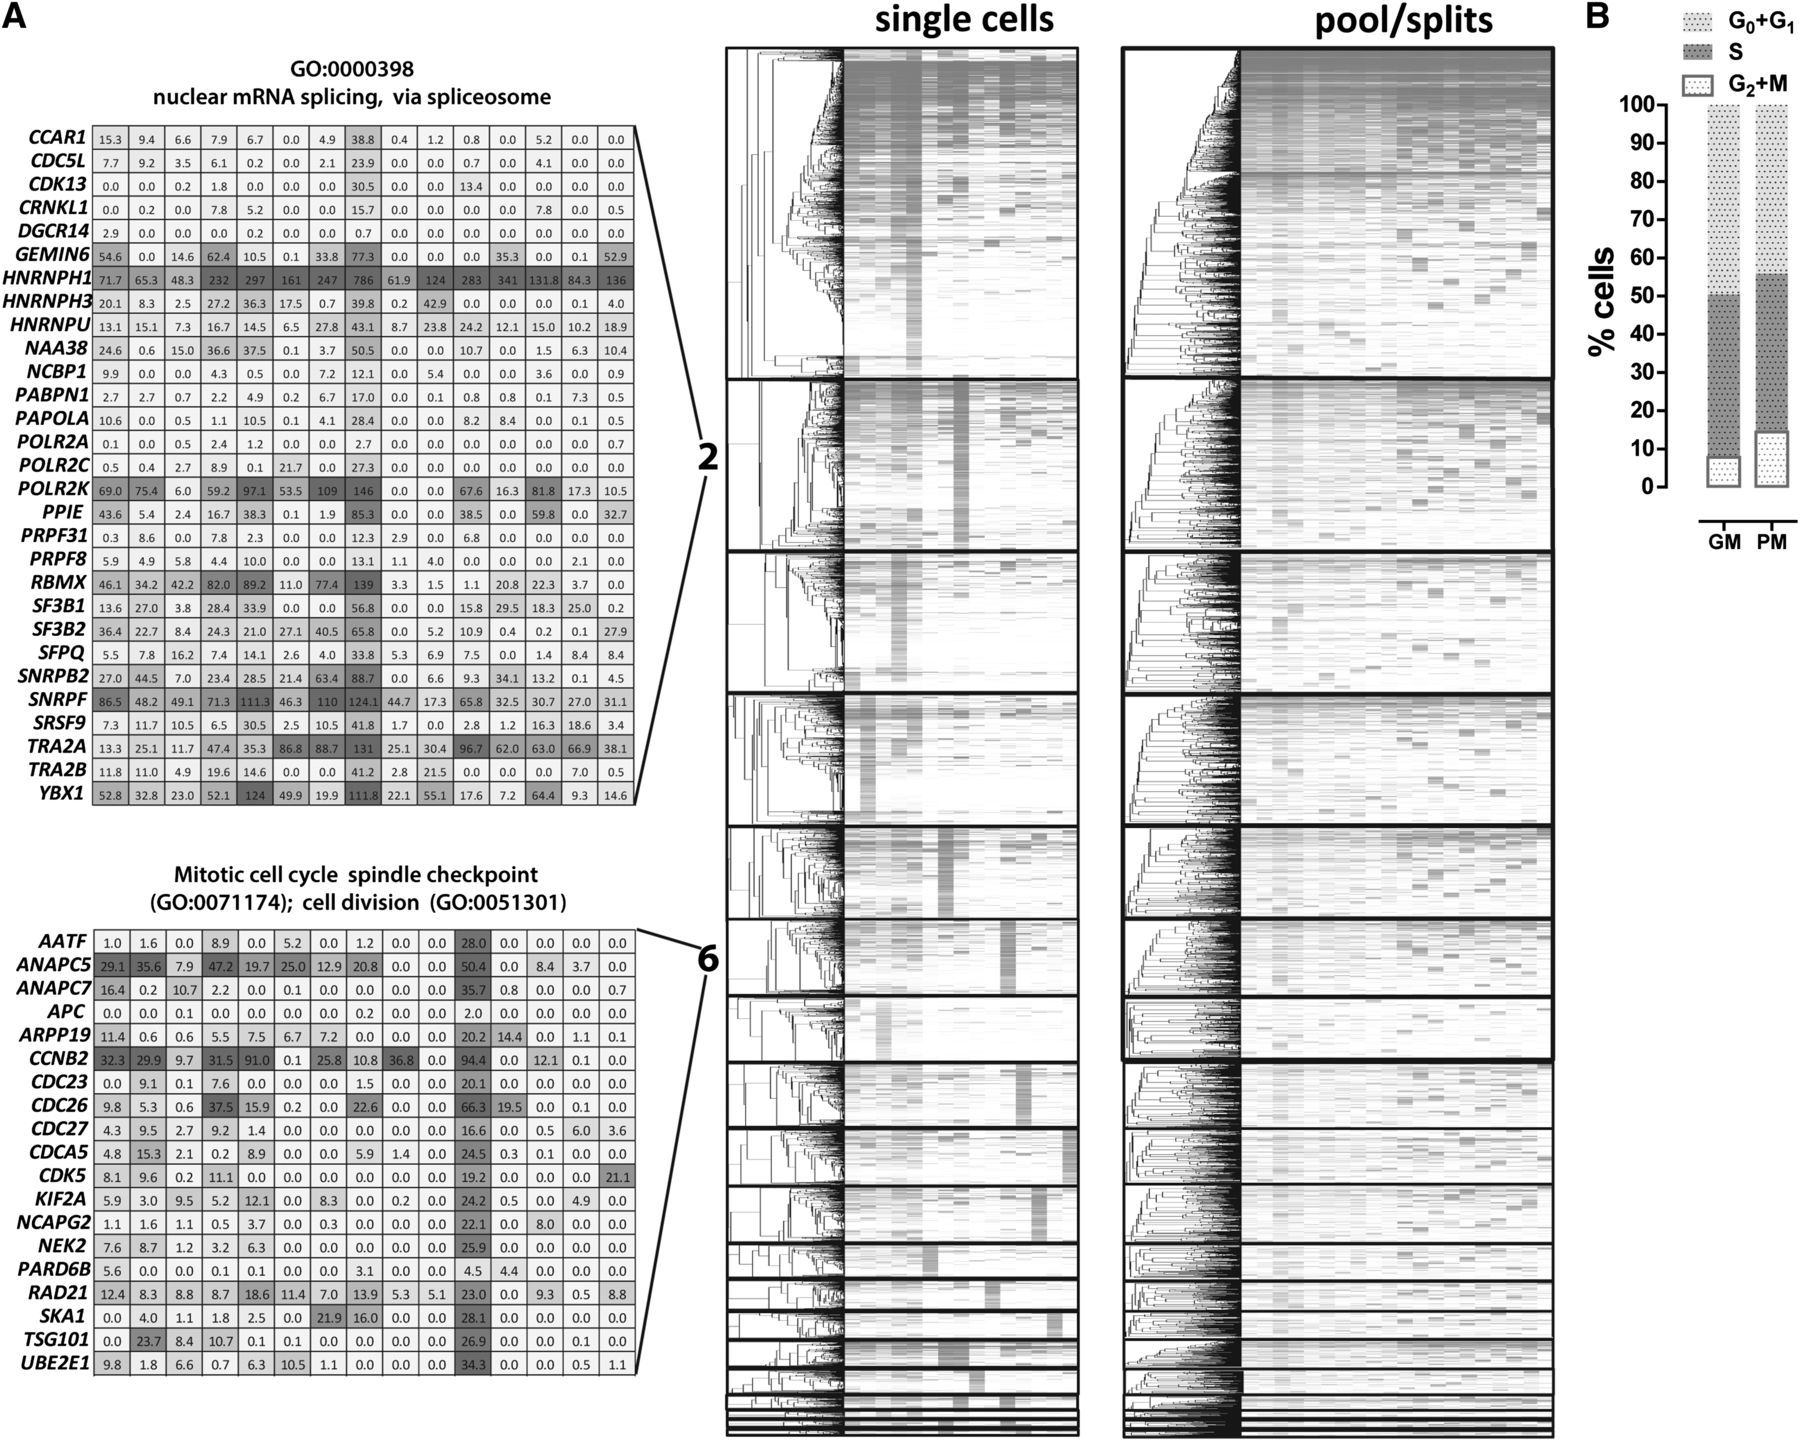
Gene coexpression modules derived from single GM12878 cells. Weighted gene correlation networks were constructed using the WCGNA R package (Langfelder and Horvath 2008). (A) Expression levels and hierarchical clustering of genes within modules (modules are sorted by number, which corresponds to their size) in single cells and pool/split experiments. Only genes are clustered (dendrograms on the left), and the identity of the cells and pool/split experiments is the same in each column (two right panels). The absolute expression values of genes belonging to representative GO categories associated with cell cycle phases (modules 1 and 6) and mRNA processing and splicing (module 2) are also shown. (B) Distribution of cell cycle states in a representative GM12878 cell population, in growth media (GM), and picking media (PM). The fraction of cells in M phase is consistent with one such cell being picked in a sample of 15.


