
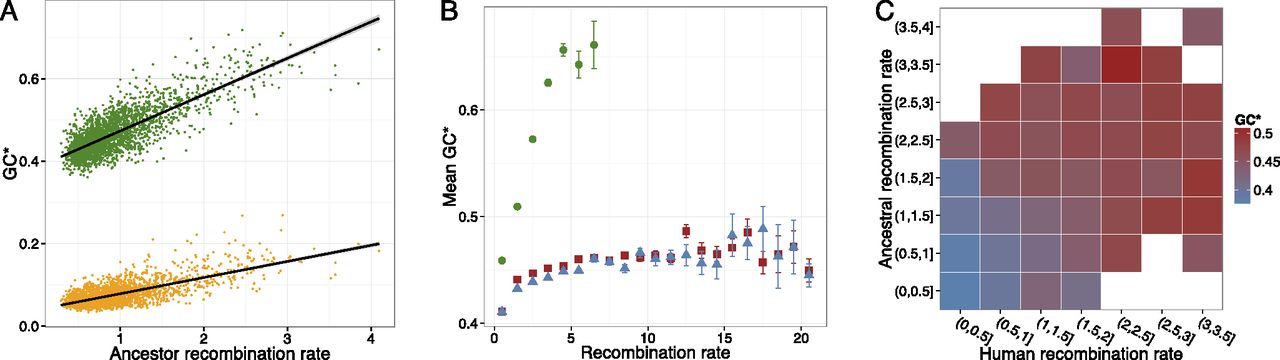
The effect of recombination on evolution of GC content in the human–chimpanzee ancestor. (A) Correlation between ancestral GC* and ancestral recombination rate in 1-Mb bins in green for non-CpG sites and yellow for CpG sites. (B) Mean GC* as a function of recombination rate for the ancestral map (green), the human map (red), and the chimpanzee map (blue). Error bars represent confidence interval of mean obtained by bootstrapping. Mean rates based on <10 observations are not shown. (C) Human GC* as a function of both ancestral and human recombination rate in bins of 0.5 cM/Mb. Each cell in the grid corresponds to an interval of ancestral and human recombination rate and is colored in accordance with mean GC* in the associated 1-Mb bins.


