
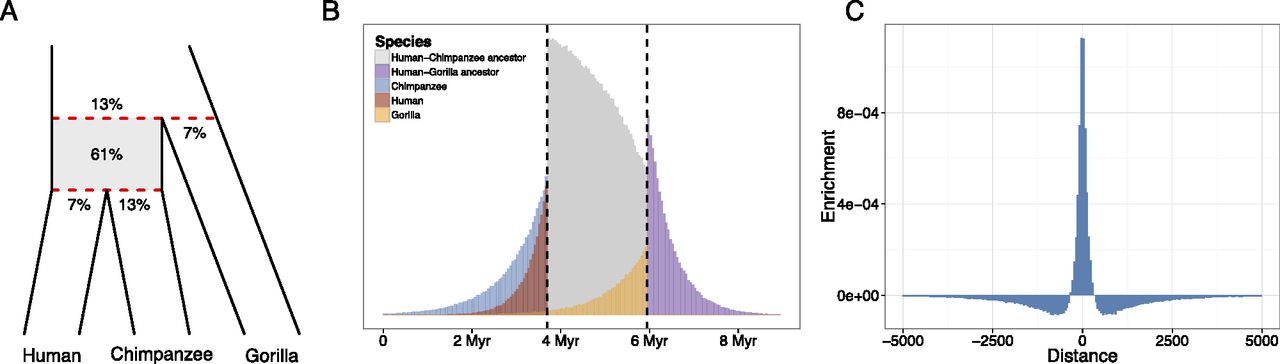
Distribution in time and accuracy of inferred recombination events. (A) Species tree with proportions of simulated crossover events that result in change between genealogies in our model, falling between and outside the speciation events (shown in red). (B) Distribution in time of simulated crossover events as in A, partitioned according to the branch of the species tree on which they occur. Vertical dashed lines indicate the speciation times used in simulations. (C) The distribution of distance between called and simulated crossover events with randomized background subtracted (distance truncated at 5000). Individual crossover points were called on alignments generated from simulations. Randomized background was obtained by randomly permuting called events prior to alignment to simulated events.


