
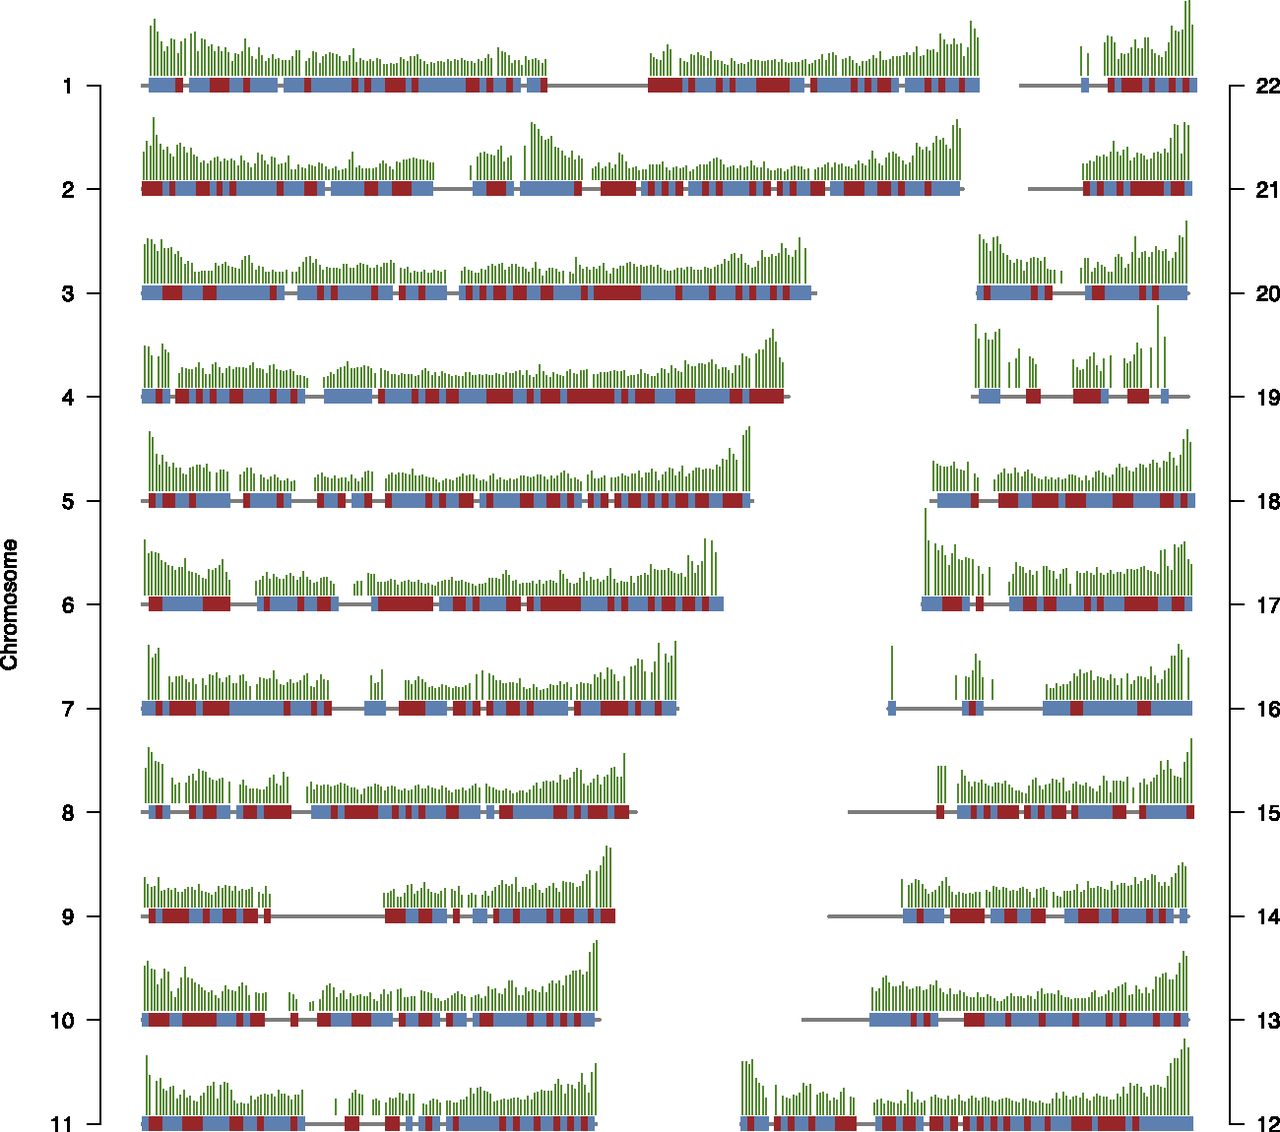
Figure 1.
Recombination map for the human–chimpanzee ancestor. The inferred recombination map normalized to a global mean of one. Each gray line represents a chromosome, and the impulses over each line represent the recombination rates for nonoverlapping 1-Mb bins. The vertical distance between chromosomes represents 5 cM/Mb. Red (blue) blocks painted on each chromosome correspond to 2-Mb regions where mean recombination rate in the human (chimpanzee) map is most similar to the ancestral map.


