
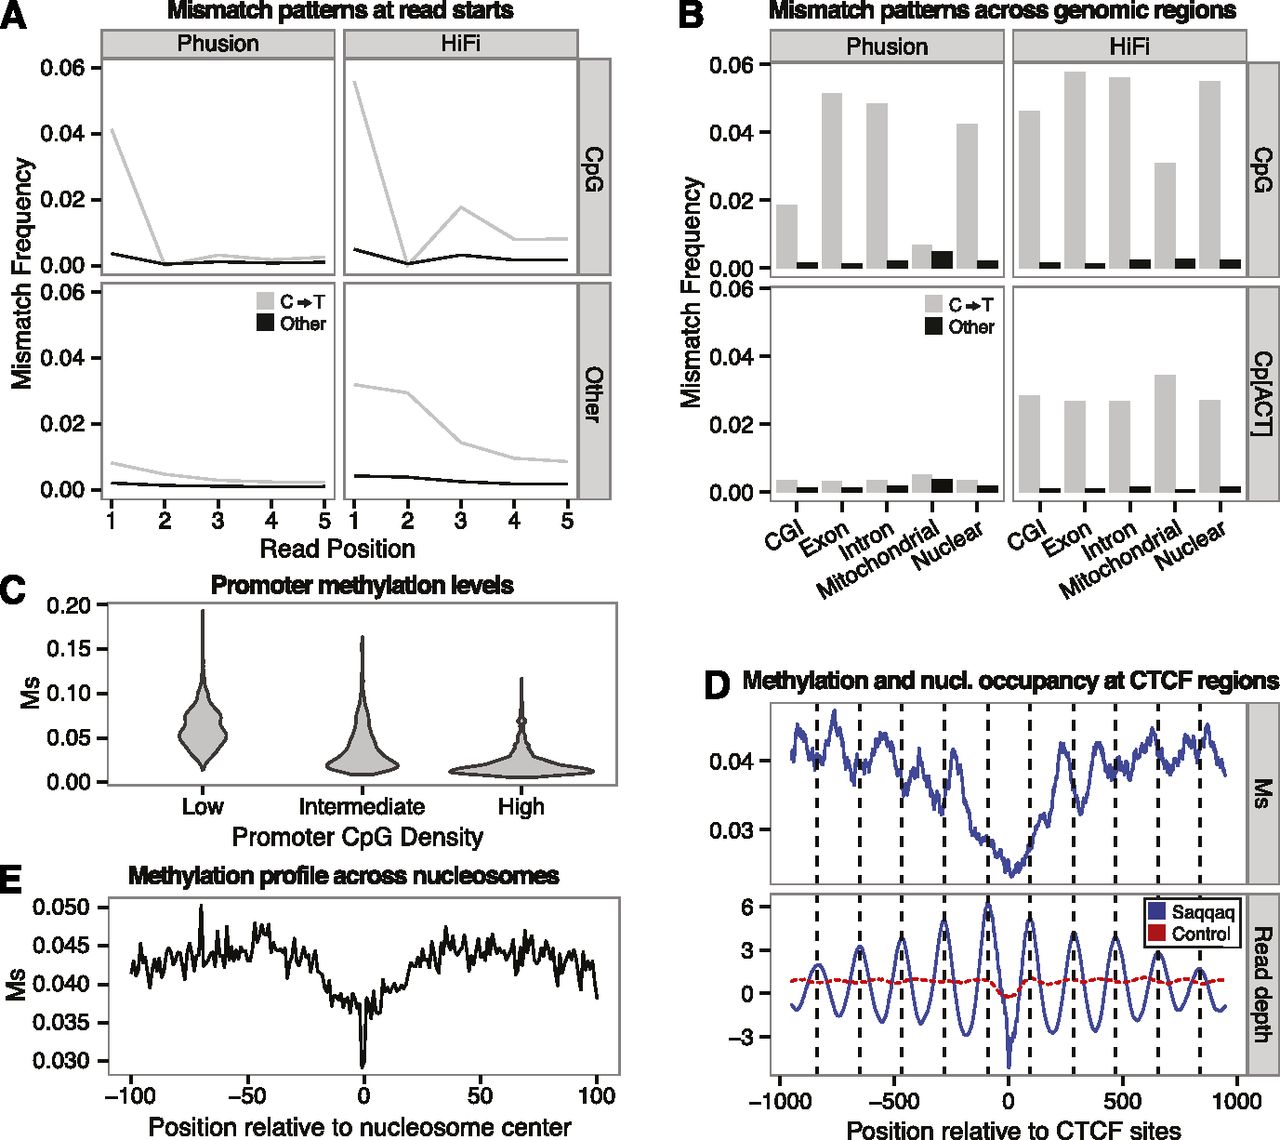
Substitution rates at CpG reveal methylation of DNA. (A) C→T mismatch rates (gray) versus rate of other mismatches (black) between a random subset of 1,000,000 Phusion (left) or HiFi (right) reads mapping uniquely. Reads are split by those starting with CpG (top; 26,864 Phusion and 25,568 HiFi reads) and other dinucleotides (bottom). (B) Mismatch frequencies for Phusion (left) and HiFi (right) for reads aligned to various genomic locations starting with the dinucleotides: CpG (top) and Cp[ACT] (bottom). (C) Distribution of Ms values for three classes of promoters with low, medium, and high CpG densities (Supplemental Material SI3.2). (D) Methylation profile (Ms, top) and read depth variation (bottom) at CTCF regions. Read depth provides a proxy for nucleosome occupancy. (E) Distribution of Ms values across nucleotide positions covered with nucleosomes, showing a depletion in methylation levels within a core region (20 nt before and after the nucleosome center) that is particularly marked at the nucleosome center.


