
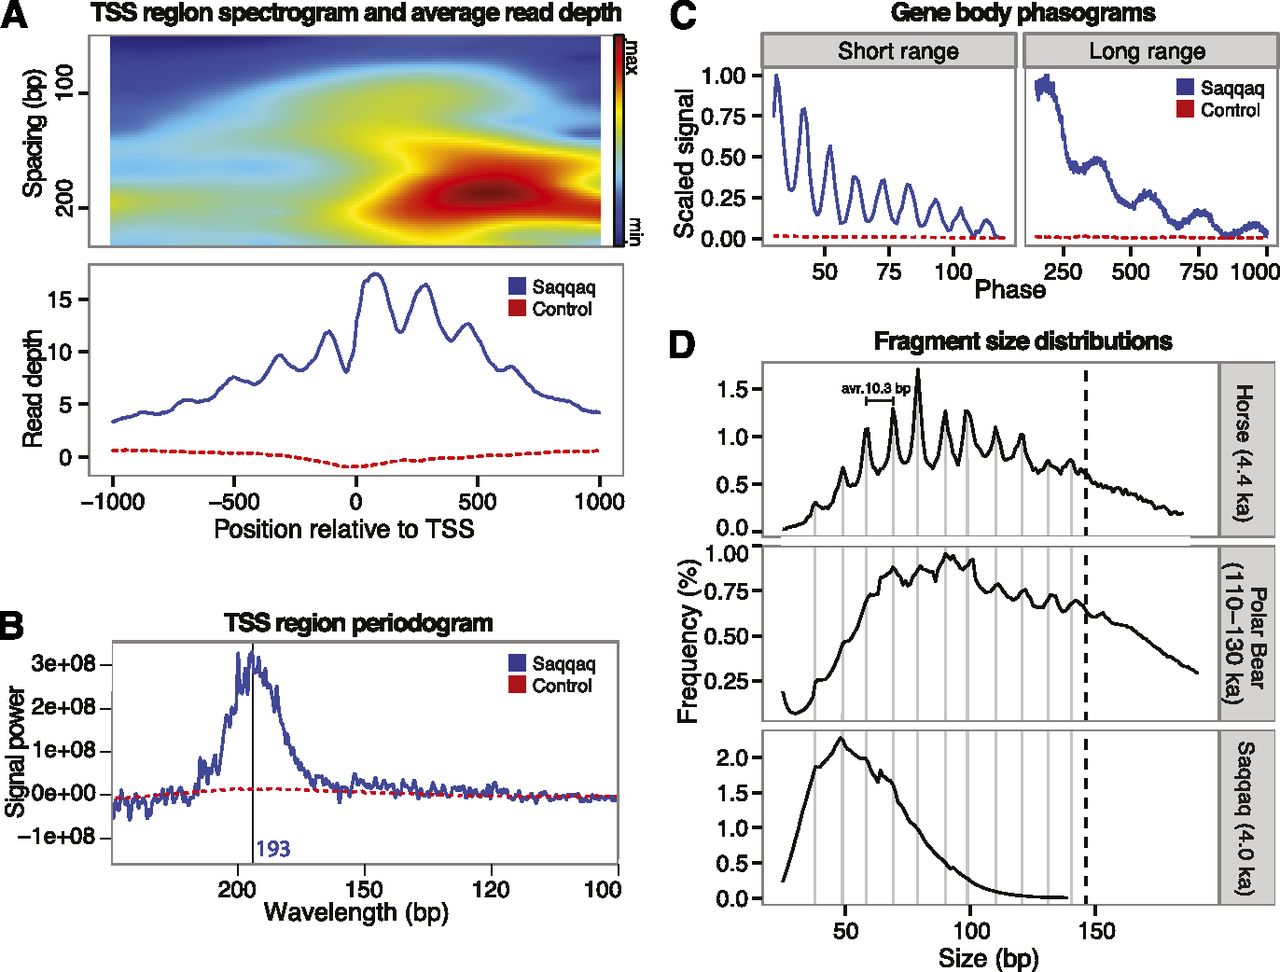
Read depth and fragment length periodicity. (A) Read-depth variation at TSS. Spectrogram around TSS (top) showing the strength of the periodicity signal at different wavelengths. Nucleosome abundance (bottom) summed over aligned transcription start sites. High occupancy at the +1 nucleosome position is characteristic of transcriptional activity. (B) Spectral density (periodogram) for TSS regions. The frequency spectrum shows a peak in relative signal at 193 bp corresponding to the expected inter-nucleosome distance. (C) 5′ read-end phasograms showing the distribution of distances between reads in gene bodies. A clear ∼200-bp periodicity is apparent, consistent with the presence of nucleosomes (right). A short-range periodicity of ∼10 bp is also apparent (left), corresponding to a turn of the DNA helix as it winds around the nucleosome. (D) Distribution of fragment sizes from ancient samples of horse (top), polar bear (middle), and Saqqaq (bottom) are consistent with preferential cleavage of exposed nucleosome-wrapped DNA strands every 10 bp.


