
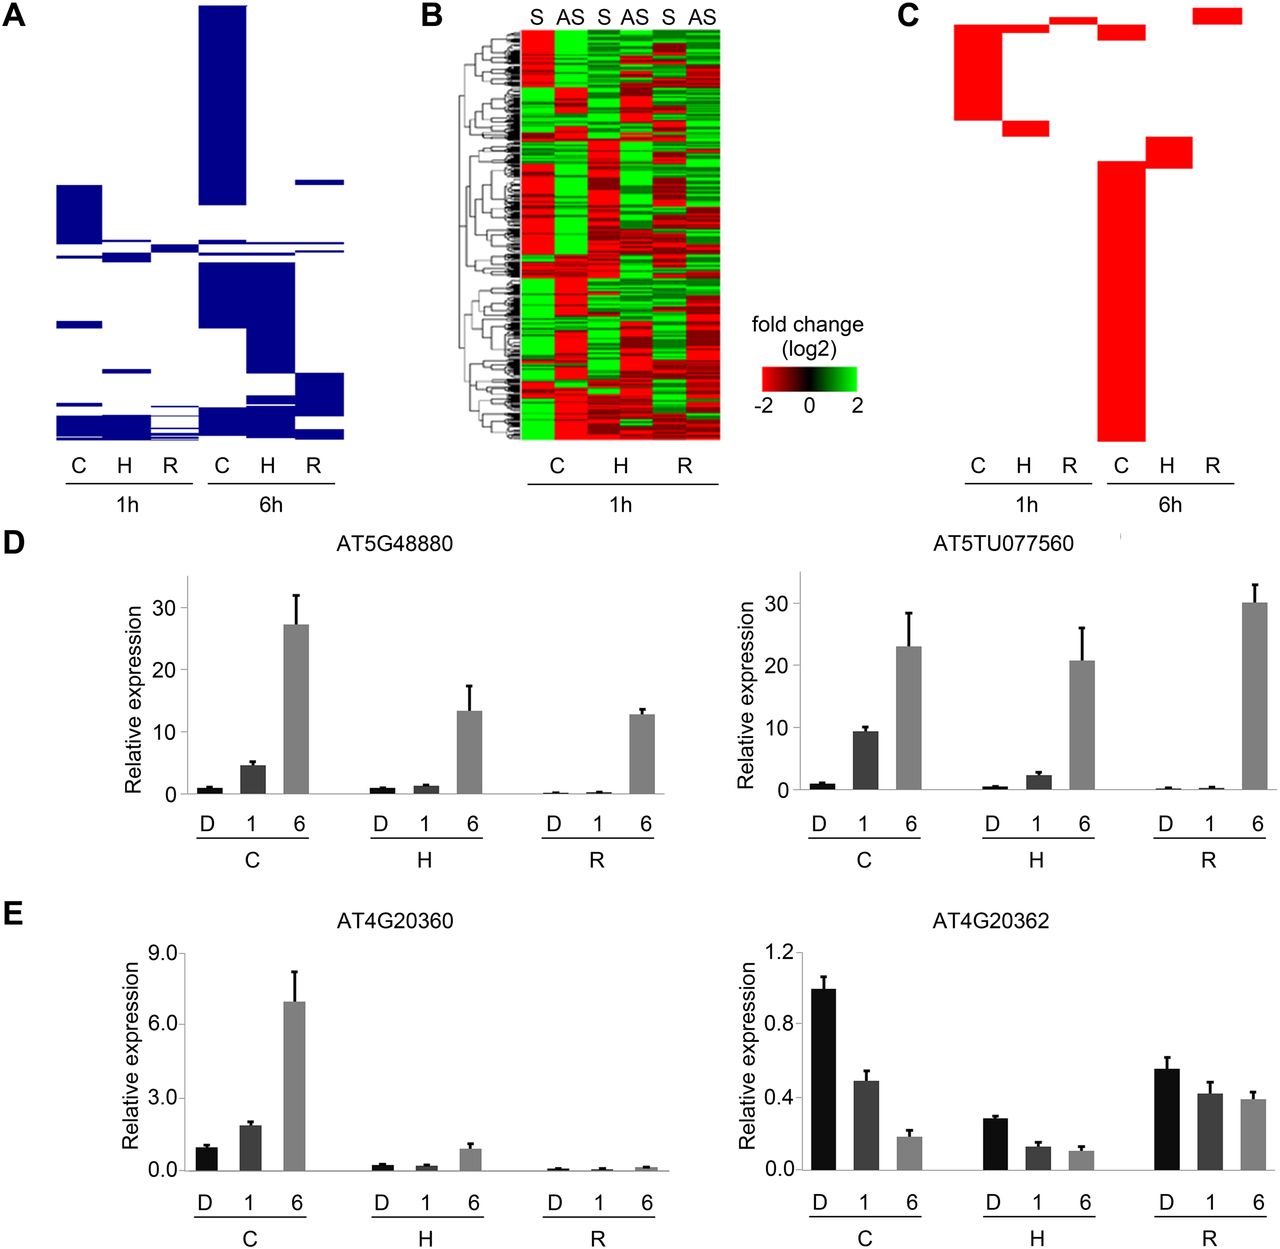
Light-regulated NAT pairs. (A) Clustering of light-regulated concordant (positively correlated) NAT pairs. Each blue line represents a light-regulated concordant NAT pair in cotyledon, hypocotyl, and root at 1 h and 6 h. (B) Heat map of discordant (negatively correlated) NAT pairs at 1 h. Expression levels of discordant sense (S) and antisense (AS) transcripts in cotyledon, hypocotyl, and root. (C) Clustering of light-regulated discordant (negatively correlated) NAT pairs. Each red line represents a light-regulated discordant NAT pair in cotyledon, hypocotyl, and root at 1 h and 6 h. (D,E) Validation of light-regulated concordant and discordant NAT pairs by qRT-PCR. Bar plot represents relative expression level. Error bar gives standard error (SE) (n = 3). (C) cotyledon; (H) hypocotyl; (R) root; (D) dark; (1) 1-h light; (6) 6-h light.


