
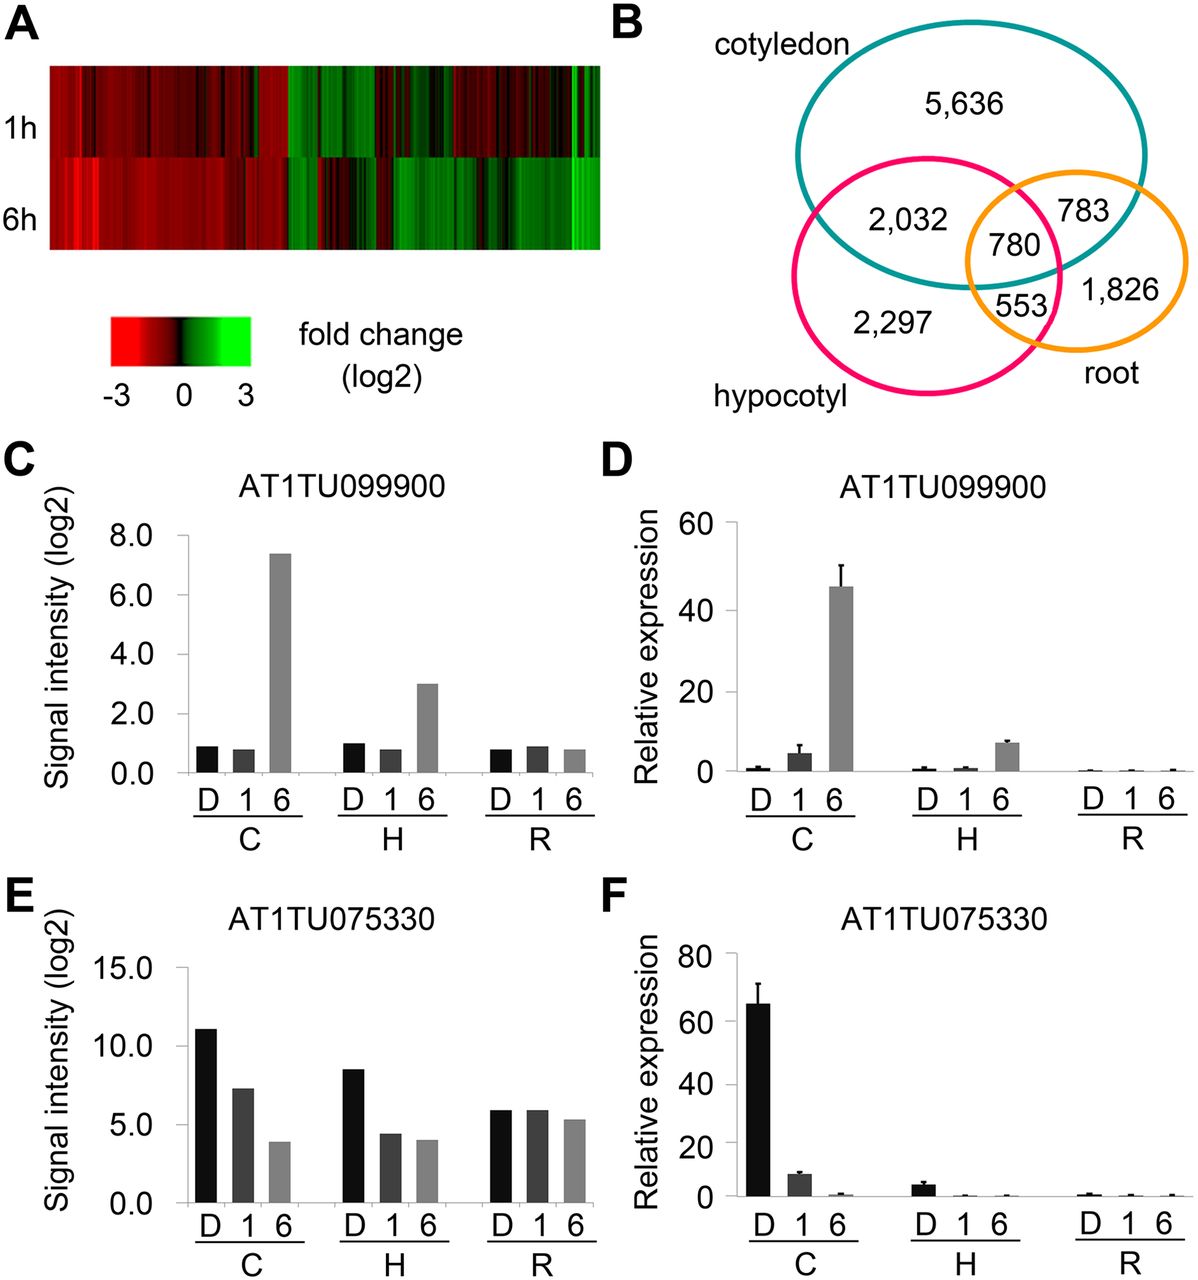
Figure 2.
Light-regulated coding and noncoding transcripts. (A) Heat map representing fold change (log2 value) of light-regulated transcript levels at 1 h and 6 h in cotyledons. (B) Organ-preferential expression of light-regulated lncRNAs. Venn diagrams show number of light-regulated transcripts in each organ. (C) Signal intensity and (D) validation by qRT-PCR of an organ-specific light-induced lncNAT. (E) Signal intensity and (F) validation by qRT-PCR of an organ-specific light-repressed lncNAT. Error bar gives standard error (SE) (n = 3). (C) cotyledon; (H) hypocotyl; (R) root; (D) dark; (1) 1-h light; (6) 6-h light.


