
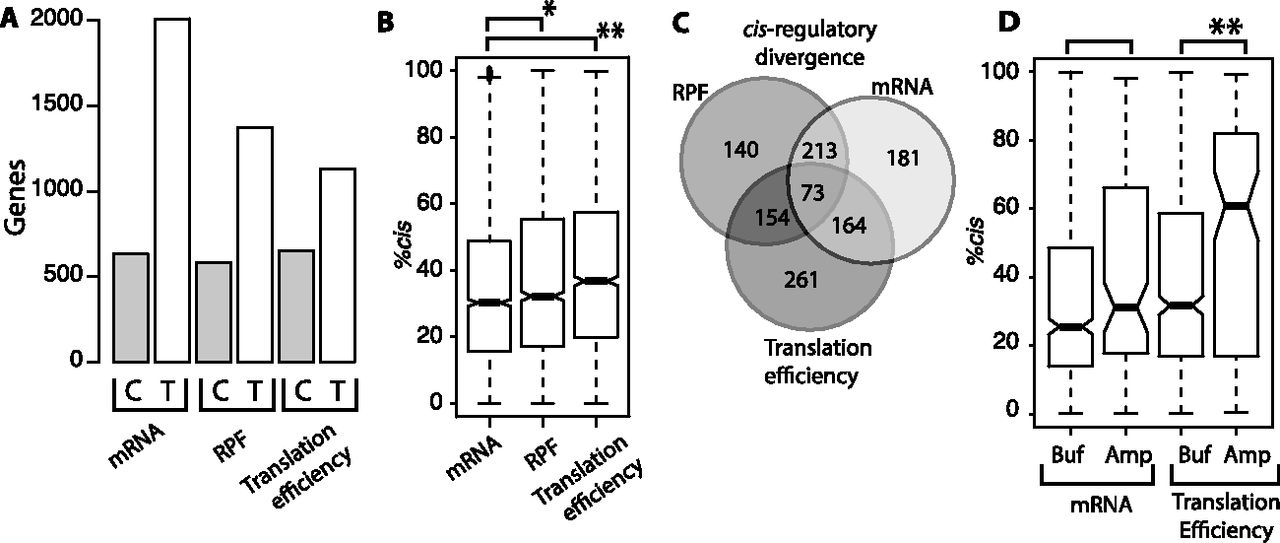
Contributions of cis- and trans-regulatory divergence in mRNA abundance, ribosome occupancy, and translation efficiency. (A) Bar plot shows the number of genes affected by significant regulatory divergence in cis-acting sequences (C) and trans-acting factors (T). Trans-acting factors contribute most to mRNA abundance. (B) Box plot showing the fraction of regulatory divergence attributable to differences in cis-regulatory elements (%cis). Ribosome occupancy and translation efficiency both have higher %cis than mRNA abundance. (C) Venn diagram showing the overlap of genes with cis-regulatory divergence in mRNA abundance, ribosome occupancy, and translation efficiency. (D) Box plot depicting %cis for genes with buffering (Buf) and amplifying (Amp) regulatory divergence of mRNA abundance (left) and translation efficiency (right). Asterisks indicate results of Wilcoxon rank-sum test comparisons: (*) P < 0.001; (**) P < 0.0005.


