
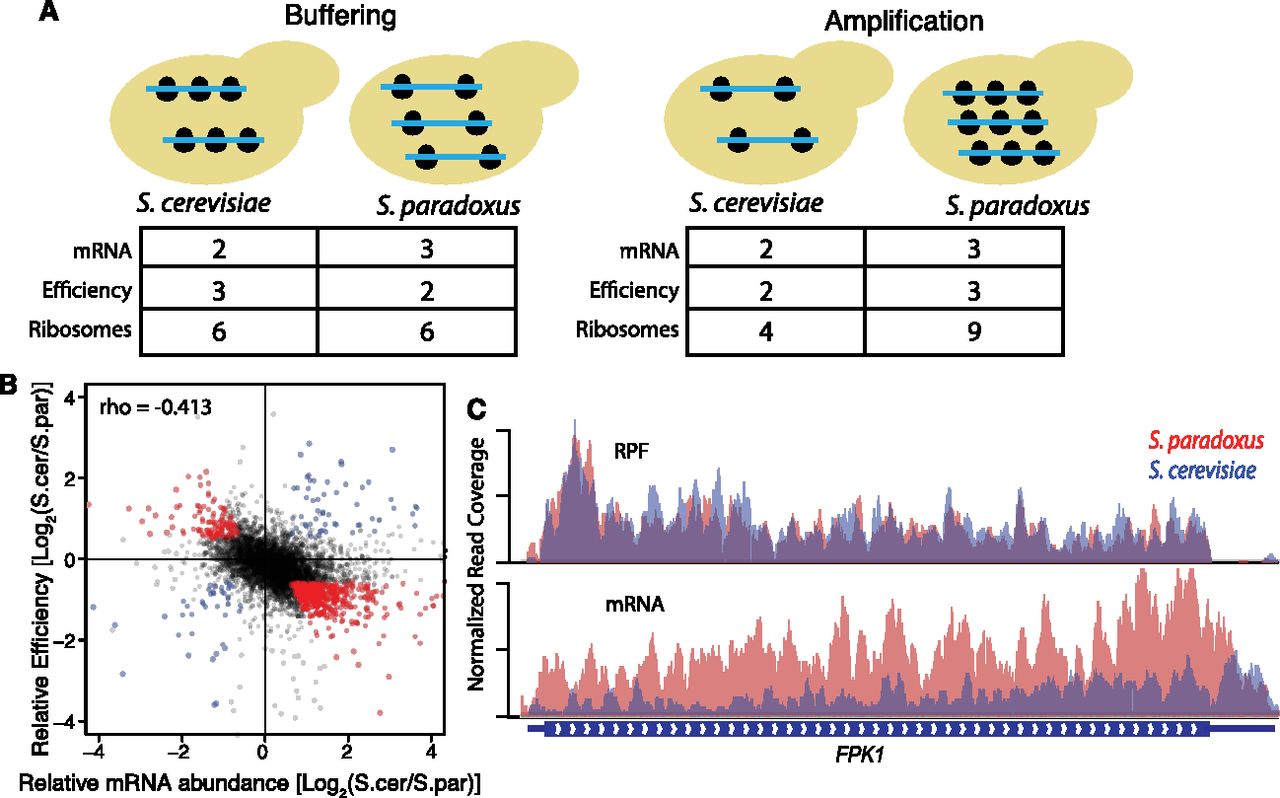
Translation regulatory divergence buffers interspecies differences in mRNA abundance. (A) Cartoon depicting buffering (left) and amplification (right). mRNA are shown as blue lines, and ribosomes are shown as black circles. Buffered genes have divergent mRNA abundance, with less divergent ribosome occupancy such that protein production is more conserved. In contrast, amplified genes have divergent mRNA abundance and even more divergent ribosome occupancy. (B) Scatterplot comparing divergent translation efficiency (y-axis, RPF/mRNA) with divergent mRNA abundance (x-axis). Buffered and amplified genes are plotted in red and blue, respectively. The negative correlation between mRNA abundance and translation efficiency suggests a genome-wide trend toward buffering. (C) Example of RPF and RNA-seq coverage over FPK1, a buffered gene. IGV browser tracks showing normalized coverage for S. cerevisiae (blue) and S. paradoxus (red).


