
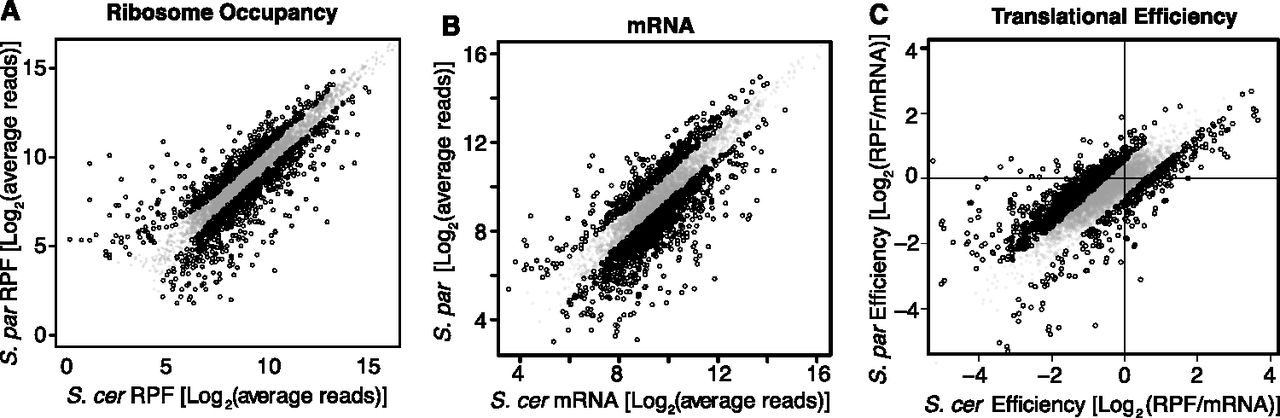
Figure 2.
Comparing regulatory divergence of ribosome occupancy, mRNA abundance, and translation efficiency. (A–C) Scatter plots compare the normalized average number of sequence reads for S. cerevisiae (x-axis) and S. paradoxus (y-axis). Genes with statistically significant differences in read counts (FDR < 5%, minimum 1.5-fold difference) are plotted as open circles with black edges. Translation efficiency is defined here as the number of ribosome protected fragment reads (RPF) divided by the number of mRNA-seq reads covering an ORF.


