
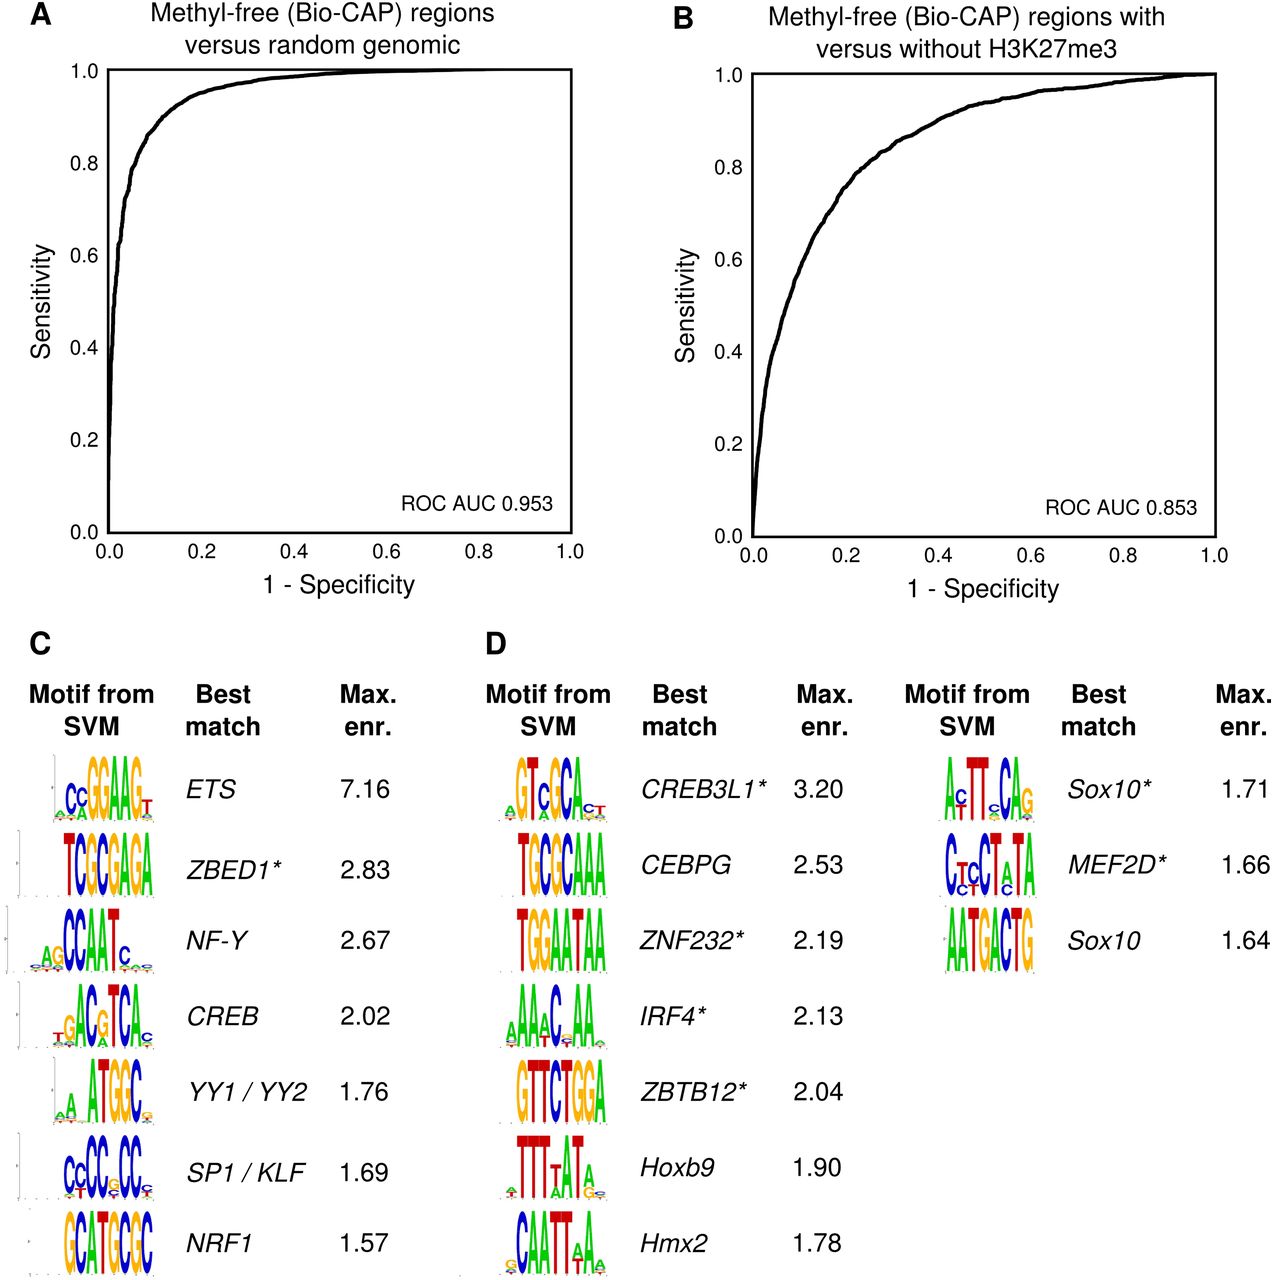
Transcription factor motifs predict the H3K27me3 state of DNA methylation-free regions. (A) ROC curve of the classification of X. tropicalis DNA methylation-free regions (Bio-CAP peaks) compared with random genomic regions using a k-mer SVM (k = 8). (B) ROC curve of the classification of DNA methylation-free regions (Bio-CAP peaks) using a k-mer SVM (k = 8). The regions are classified as either gaining H3K27me3 or remaining devoid of H3K27me3. (C) Motifs from k-mers with a high SVM weight, which are enriched in (active) DNA methylation-free regions without H3K27me3. The best match to known motifs is shown; uncertain matches are marked with an asterisk. (D) Motifs from k-mers with a low SVM weight that are enriched in (repressed) DNA methylation-free regions with H3K27me3.


