
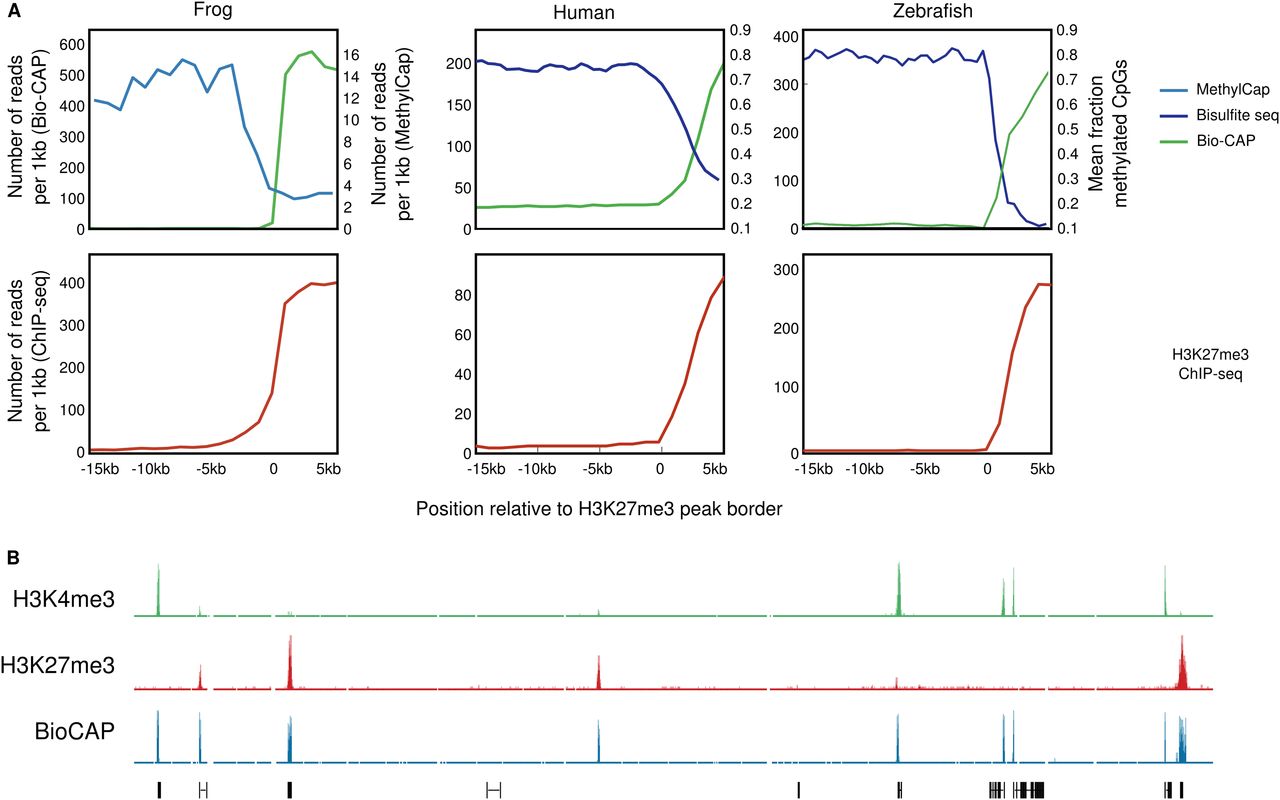
H3K27 methylation in DNA methylation-free regions. (A) The methylation state (top panel) and H3K27me3 enrichment (bottom panel) visualized over H3K27me3 domain borders. The methylation state assessed by MethylCap (X. tropicalis; light blue) or bisulfite sequencing (human and zebrafish; dark blue) is shown, as well as the Bio-CAP signal (green). For H3K27me3 ChIP-seq, MethylCap, and Bio-CAP, the number of reads per 1 kb is shown from −15 kb to +5 kb relative to the H3K27me3 domain border. The bisulfite seq signal indicates the mean fraction of methylated CpGs. For data sets, see Supplemental Table 6. (B) Screenshot of a representative profile of H3K4me3 (green), H3K27me3 (red), and Bio-CAP (blue) ChIP-seq enrichment in X. tropicalis blastula-stage embryos.


