
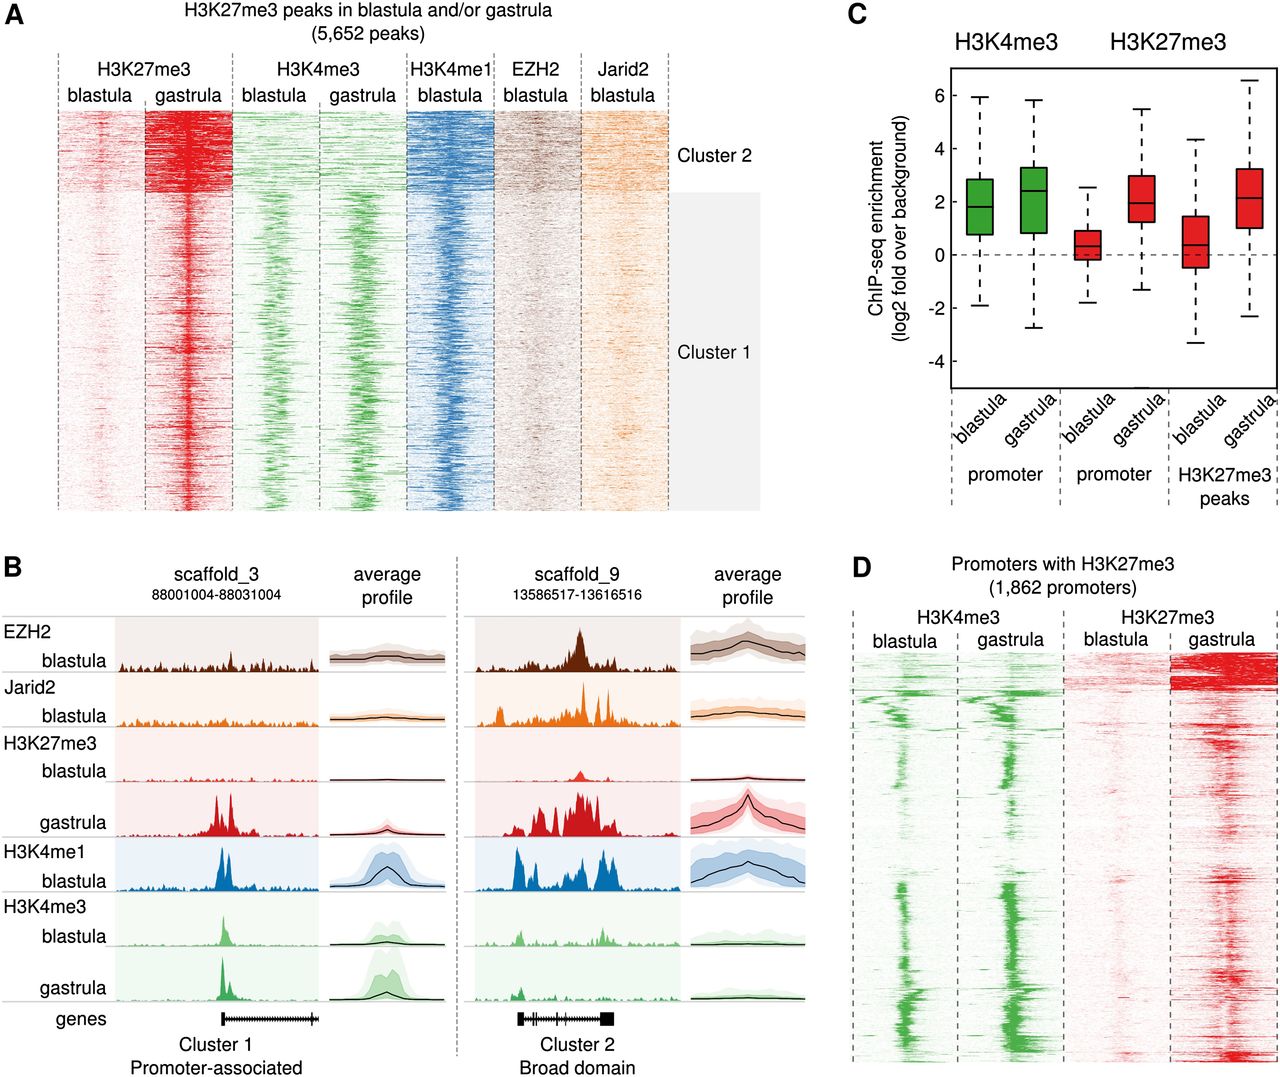
H3K27me3 is newly deposited from blastula stages onward. (A) Heatmap of a k-means clustering analysis (k = 3, Euclidian distance) of H3K27me3 (blastula and gastrula), H3K4me3 (blastula and gastrula), H3K4me1, Ezh2, and Jarid2 (blastula) in 10-kb regions around H3K27me3 peak summits. The rows correspond to the peaks, the x-axis shows the position relative to the peak center. The intensity of the color represents the number of reads in 100-bp windows. The first two clusters are shown: for cluster 3, see Supplemental Figure 1. (B) Average profile and representative example of the two clusters shown in A. The average profiles show the median enrichment (black line) and the 50th and 90th percentiles in a darker and lighter color, respectively. (C) Boxplot showing enrichment of H3K4me3 (green, left) and H3K27me3 (red, right) in 2-kb regions around the TSS for genes marked by H3K27me3 in the blastula or gastrula stage (“promoter”), and all peaks for H3K27me3 in any stage (“H3K27me3 peaks”). The y-axis represents log2 of the fold enrichment compared with randomly selected genomic sequences. The background level (no enrichment; log2 of 0) is marked by a dotted line. (D) H3K4me3 (green) and H3K27me3 (red) enrichment in blastula- and gastrula-stage embryos around transcription start site (TSS; ±5 kb) marked by H3K27me3 in the gastrula. Regions were clustered using hierarchical clustering with the Euclidian distance metric.


