
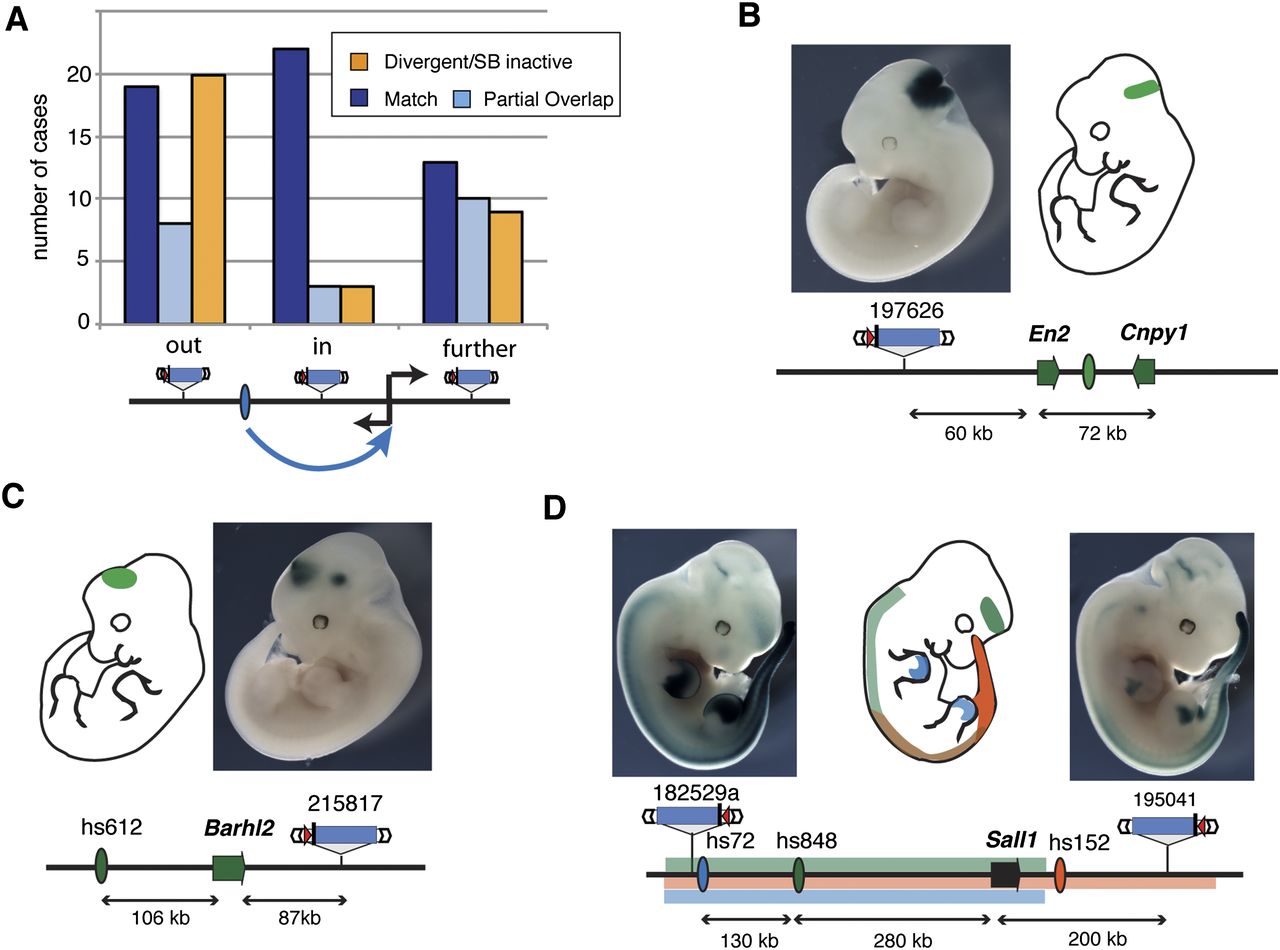
Non-gene-centric enhancer activities are detected across large distances. (A) The number of insertions that correctly (blue) or partially (light blue) reported the activity of a neighboring tissue-specific enhancer, or showed a different activity (orange). Insertions were grouped depending on their position relative to the enhancer/target gene, as shown below the chart. (B–D) Examples of expression detected with the regulatory sensor (photos) in non-gene-centered situations. Gene (arrows) and enhancer (ovals) activities are color-coded and shown on the embryo outline. (B) An insertion between the En2 and Cnpy1 genes matches their expression at the mid/hindbrain junction (Jukkola et al. 2006), as well as the activity of an enhancer on the far side of En2 (see also Supplemental Fig. 8) (C) Barhl2 expression in the midbrain and diencephalon requires remote enhancers (Saba et al. 2005), and a diencephalon enhancer (hs612) (Visel et al. 2007) is present upstream of this gene. Enhancer activity extends to a downstream insertion. (D) Sall1 gene expression is controlled by multiple enhancers spread in the two surrounding gene deserts, and insertions flanking the gene display overlapping expression patterns.


