
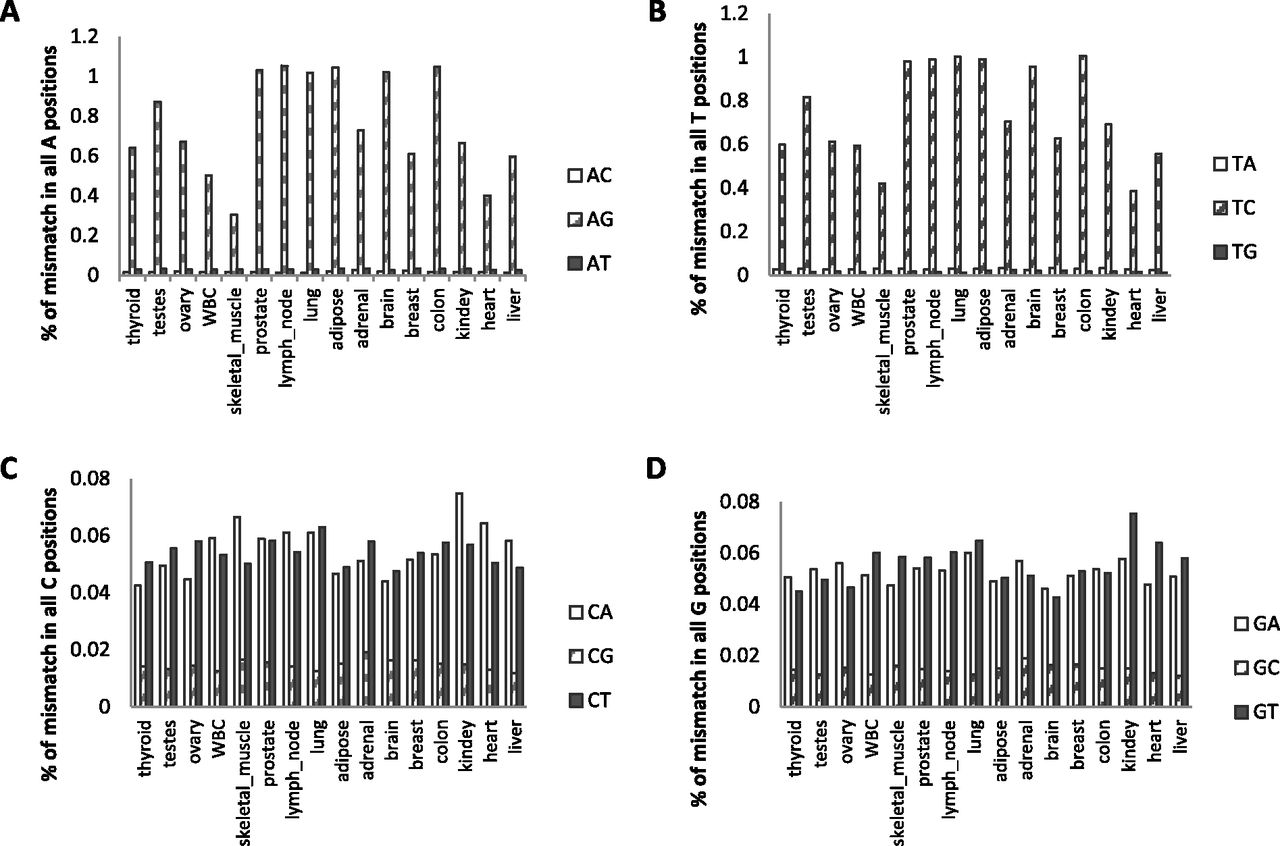
Figure 5.
Average editing levels per tissue in HBM data. For each tissue, the total mismatches (before filtering) are grouped for each of the four bases and presented according to the mismatch type. Although in A (T) positions, only one type of mismatch is dominant (G or C, accordingly), at C and G the picture is very different, exhibiting a lower number of mismatches (note the different scale) with a more even distribution. (A) A reference positions with non-A reads, per tissue. (B) T reference positions with non-T reads, per tissue. (C) C reference positions with non-C reads, per tissue. (D) G reference positions with non-G reads, per tissue.


