
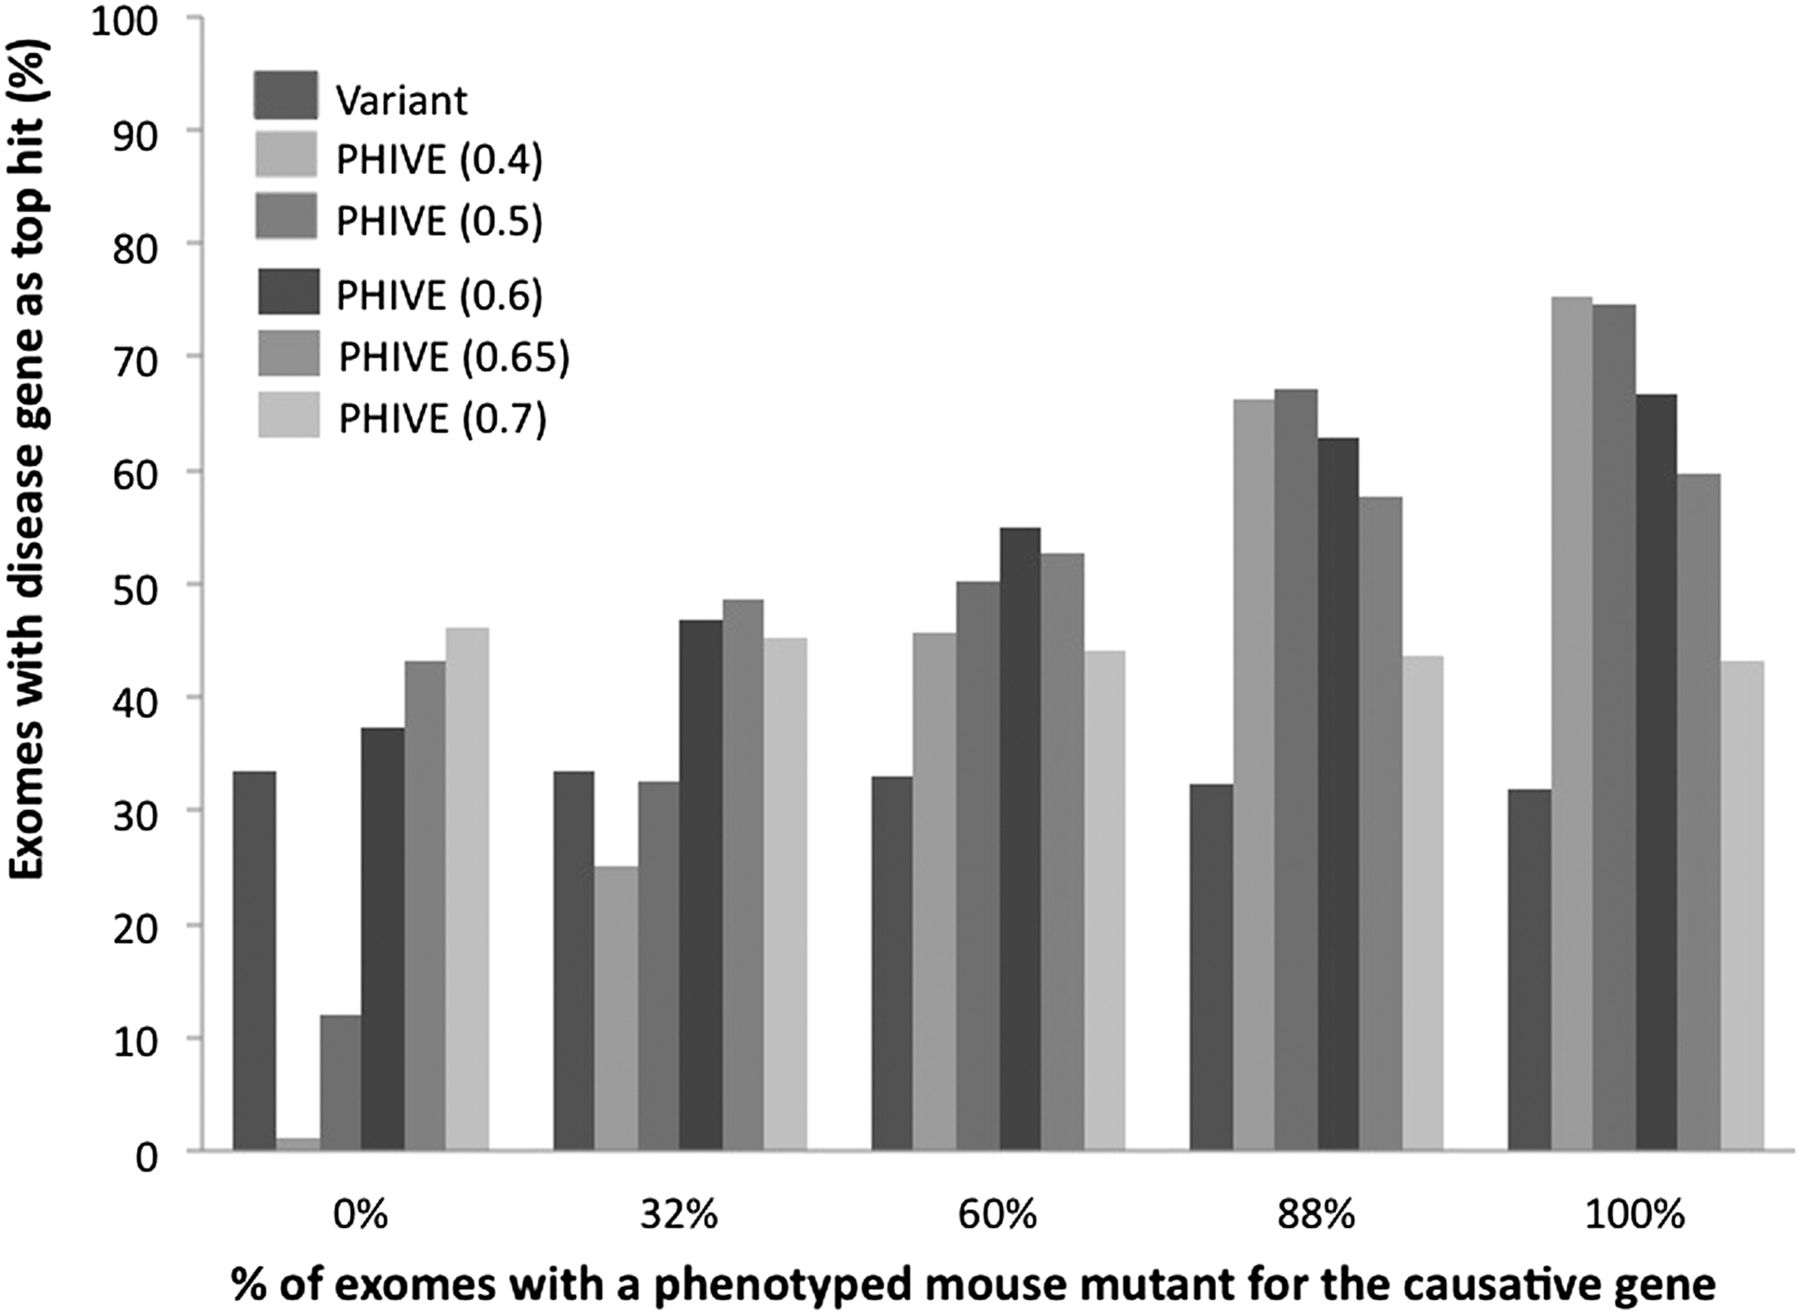
Comparison of different default phenotypic relevance scores for variants where no phenotyped mouse model exists for the gene containing the variant. The individual groups show the results after filtering to remove common, synonymous, and noncoding variants for exomes in which either 0, 32%, 60%, 88%, or 100% of the simulated exomes have a causative variant with mouse phenotype data for the orthologous gene. Thirty-two percent represents the current coverage of human protein-coding genes by phenotype data for the mouse ortholog. Eighty-eight percent represents the phenotypic coverage of disease-associated genes from the HGMD data set used throughout our studies. The bars show the percentage of times in which the true disease gene was assigned the top scoring match in 100,000 simulated WES data sets per analysis after prioritization based on either the variant score or PHIVE score using default phenotypic relevance scores of 0.4, 0.5, 0.6, 0.65, or 0.7.


