
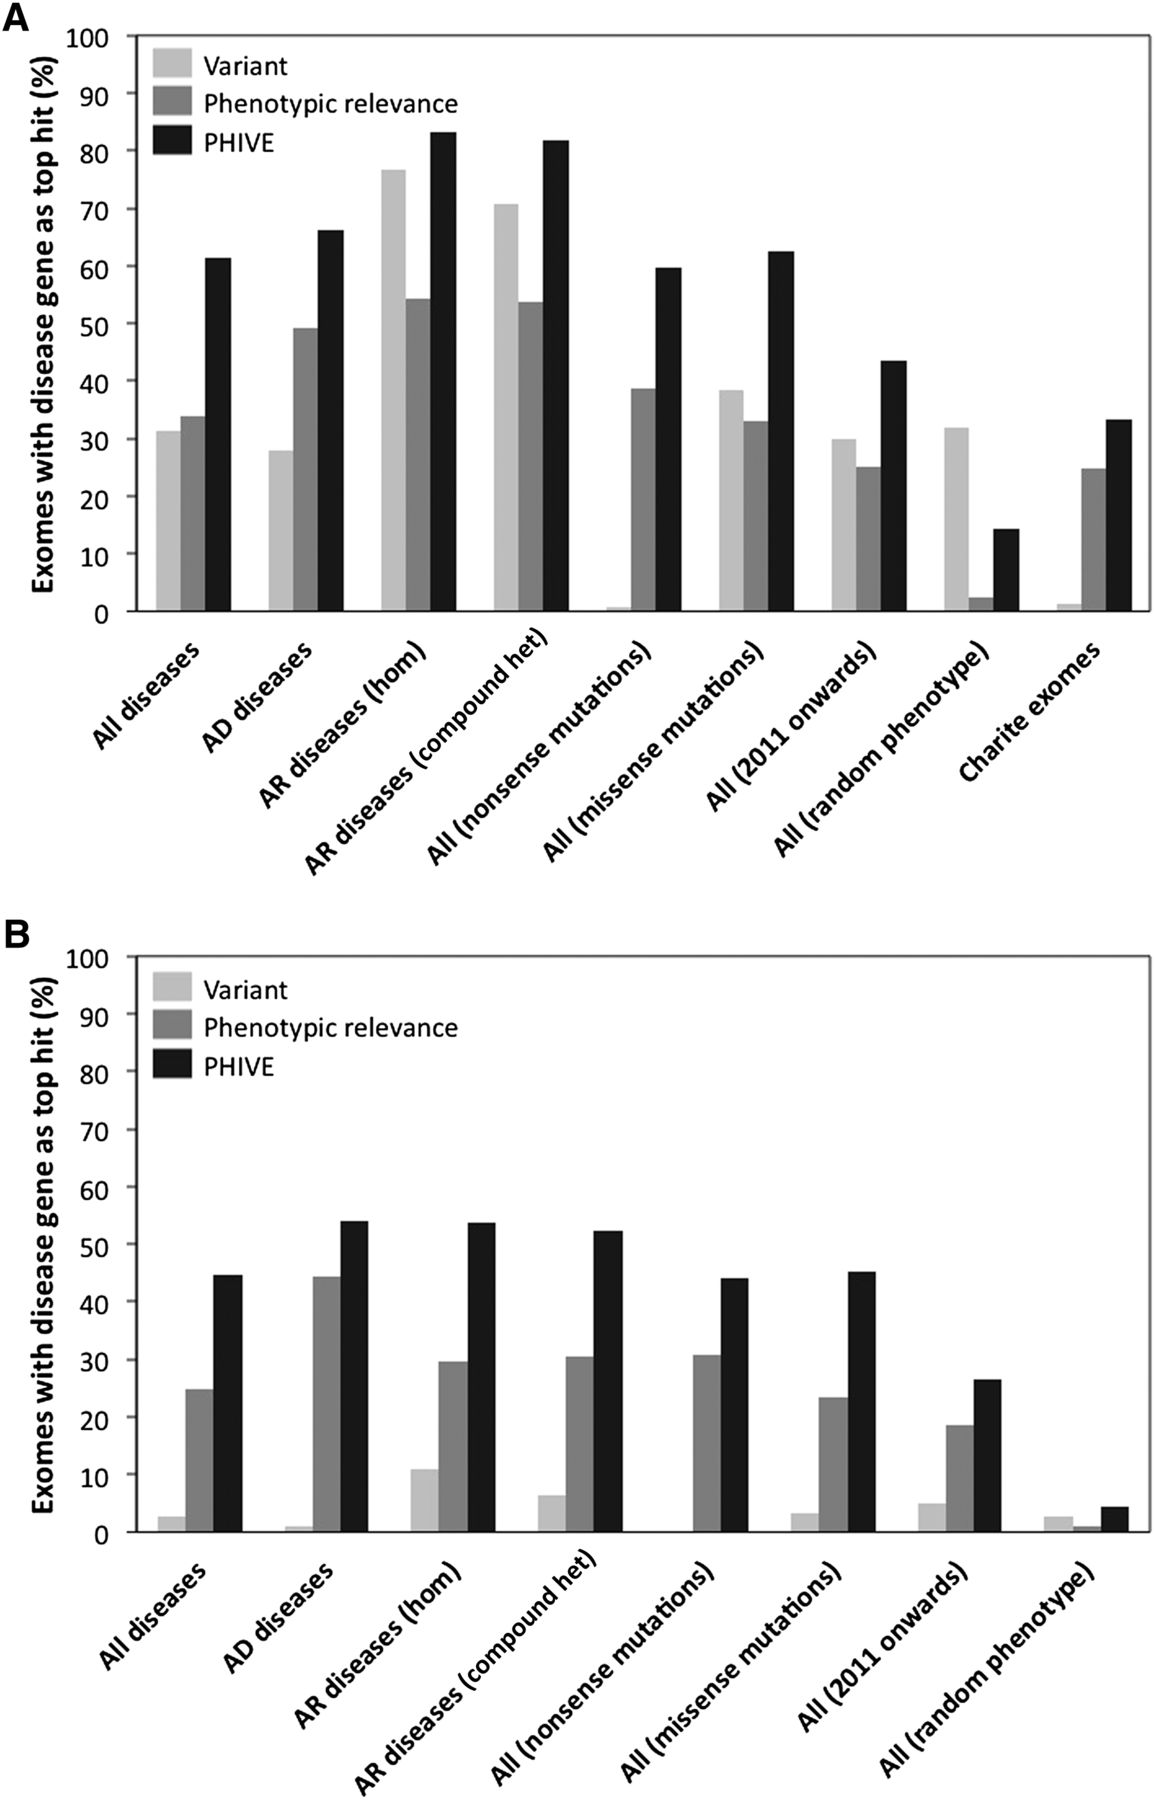
Comparison of different Exomiser filtering and prioritization strategies, including frequency data from either the ESP and the 1000 Genomes Project (A), or only ESP (B) to remove any potential bias due to the noncausative variants also coming from the 1000 Genomes Project. The first four groups of results show filtering of exomes (mean genes before filtering = 8388) by (1) removal of common, synonymous, and noncoding variants (mean genes after filtering = 400; 98.1% of disease variants retained) for All diseases, (2) further restriction to those compatible with Autosomal dominant (mean genes after filtering = 379; 98.5% of disease variants retained), or (3) Autosomal recessive inheritance by either homozygous or compound heterozygous mutation (mean genes after filtering = 37; 97.8% of disease variants retained). The performance for all diseases is also broken down into nonsense and missense mutations. In addition, we show the performance for all diseases in which the associated gene was discovered in 2011 or 2012 and the performance in which a random set of disease phenotype annotations were used rather than those of the disease being tested. Finally, the performance when adding known disease mutations to 144 exome samples from our own center rather than the 1000 Genomes Project exomes is shown. The bars show the percentage of times in which the true disease gene was assigned the top ranking match in 100,000 simulated WES data sets per analysis after prioritization based on the PHIVE score, variant score, and phenotypic relevance score.


