
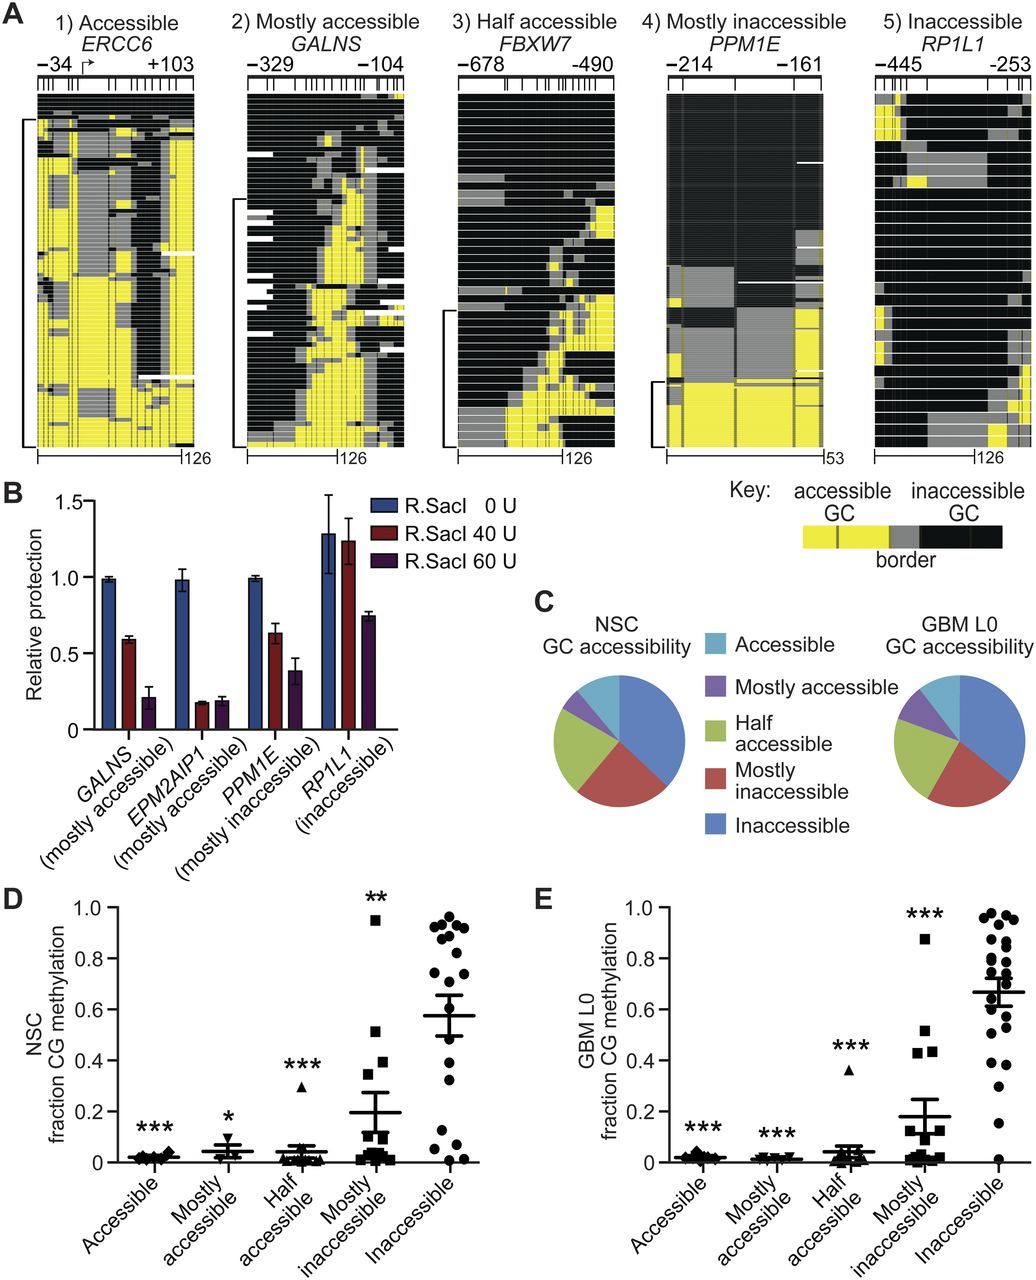
Chromatin accessibility in NSC and GBM L0 is heterogeneous and inversely associated with CG methylation. (A) Representative promoters exhibiting the five different GC accessibility patterns. Scale bars in base pairs included at bottom. Brackets at left of each image indicate accessible molecules. (B) Quantitative confirmation of different classes of chromatin accessibility identified by MAPit-patch obtained by measuring protection of SacI sites in the indicated promoters from 0, 40, or 60 units R.SacI activity. Each bar represents the mean protection for each promoter relative to 0-unit R.SacI ± 0.5 of the range (n = 2), normalized to a control locus lacking a SacI site. (C) Distribution of all analyzed promoters into the five accessibility classes for NSC (left) and GBM L0 (right). Dot plots for (D) NSC and (E) GBM L0 of CG methylation in each GC accessibility class. Mean fractions of CG methylation ± SEM are plotted. (*) P < 0.05; (**) P < 0.01; and (***) P < 0.001 relative to fraction CG methylation in inaccessible promoters for each sample.


