
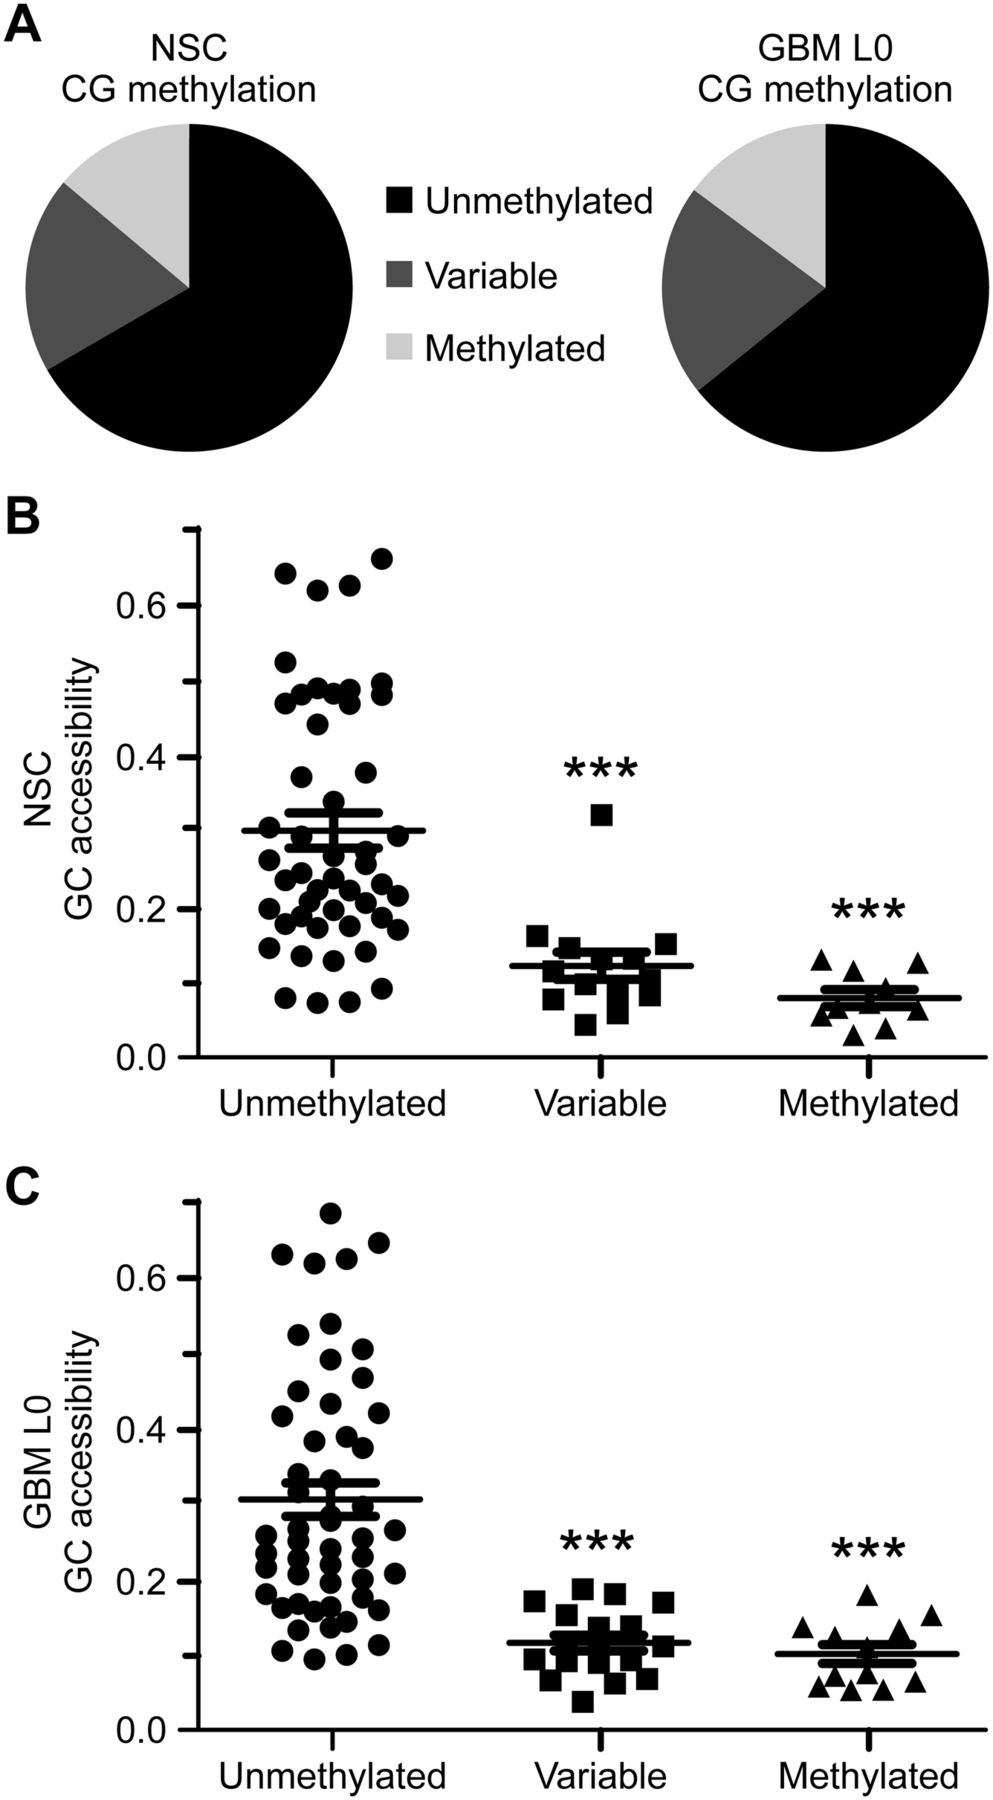
Figure 4.
Overall distribution in NSC and GBM L0 of patterns of promoter CG methylation is similar and inversely associated with GC accessibility. (A) Distribution of promoters by methylation status in NSC (left) and GBM L0 (right). Dot plots of fraction of GC accessibility within each promoter methylation class in (B) NSC and (C) GBM L0. The mean fractions of GC accessibility ± one standard error of the mean (SEM) are indicated. (***) P < 0.001 compared to GC accessibility from unmethylated promoters for each sample.


