
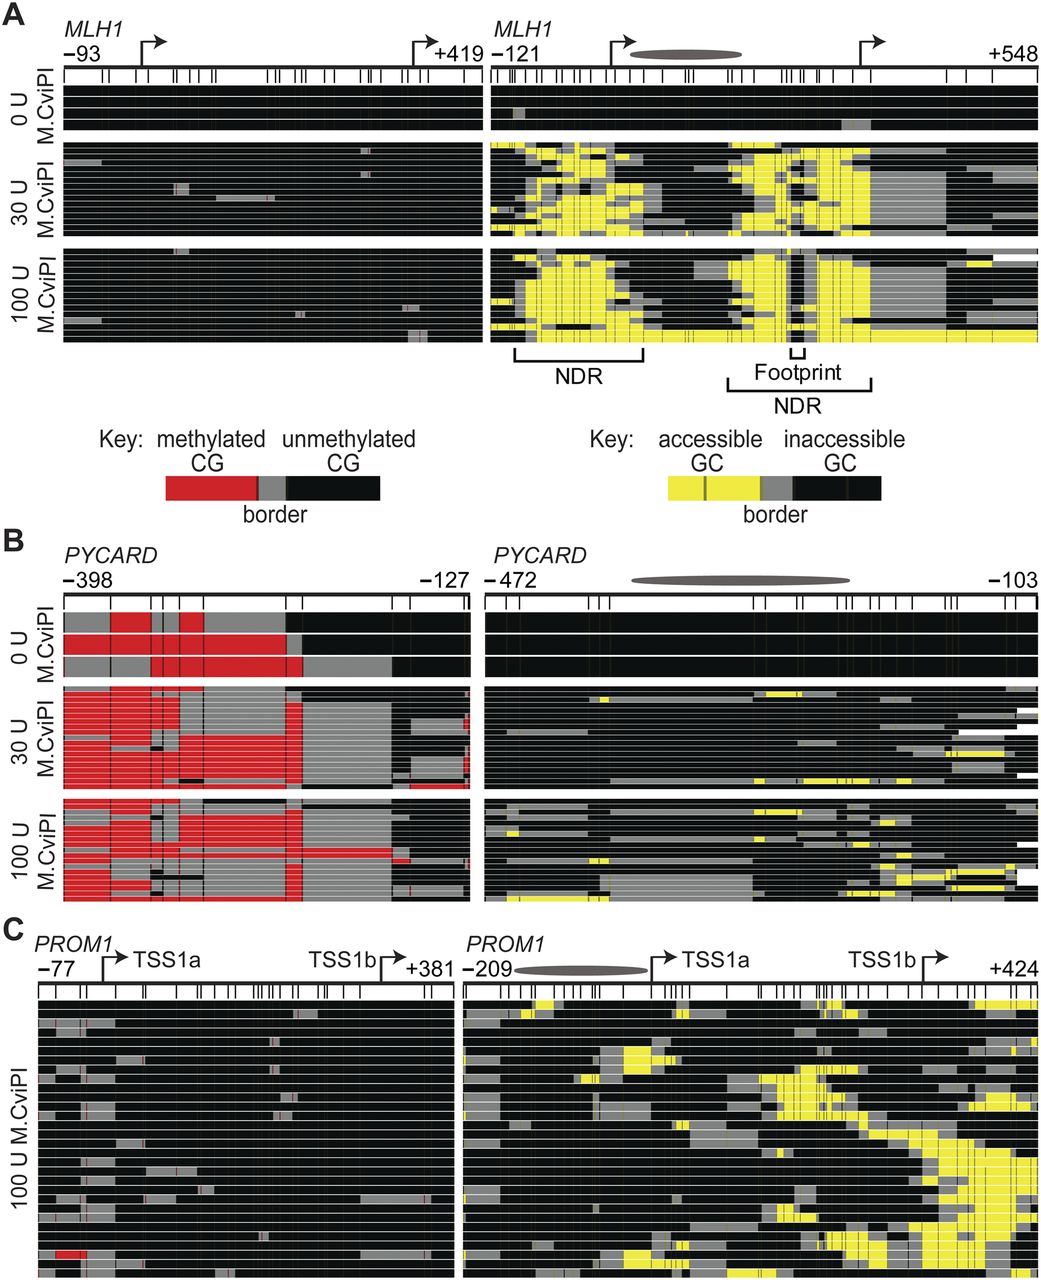
MAPit identifies expected epigenetic patterns and detects heterogeneous chromatin structures at specific loci. MAPit-BGS in NSC nuclei of the promoters of (A) MLH1 (expressed), (B) PYCARD (silenced), and (C) PROM1 (heterogeneously expressed) probed with the indicated units (U) of M.CviPI activity. A schematic of each promoter is indicated at the very top: bent arrows, TSSs; ellipses, length of a 147-bp nucleosome core particle; map coordinates relative to the first TSS are indicated for the most upstream and downstream CG (left) or GC (right) sites. Data were plotted with MethylMapper; each row of pixels represents one sequenced DNA strand or molecule, with the same top-to-bottom presentation order in each panel. Vertical hashes demarcate individual CG (left) or GC (right) sites (GCG excluded), and an additional site density plot is shown below each promoter schematic. The key for CG or GC methylation status is shown in A, bottom. Two or more consecutively methylated CG and GC sites are connected by red and yellow, respectively, whereas two or more consecutively unmethylated CG and GC sites are connected by black. Gray connects the borders between methylated and unmethylated sites. White at either end of a molecule indicates missing or unaligned sequence. Note a variably positioned NDR associated with the neural-specific TSS1b in the PROM1 promoter in C, whereas both TSSs at MLH1 in A colocalize with an NDR, the downstream from which is occupied by a DNA-binding factor(s) (labeled footprint).


