
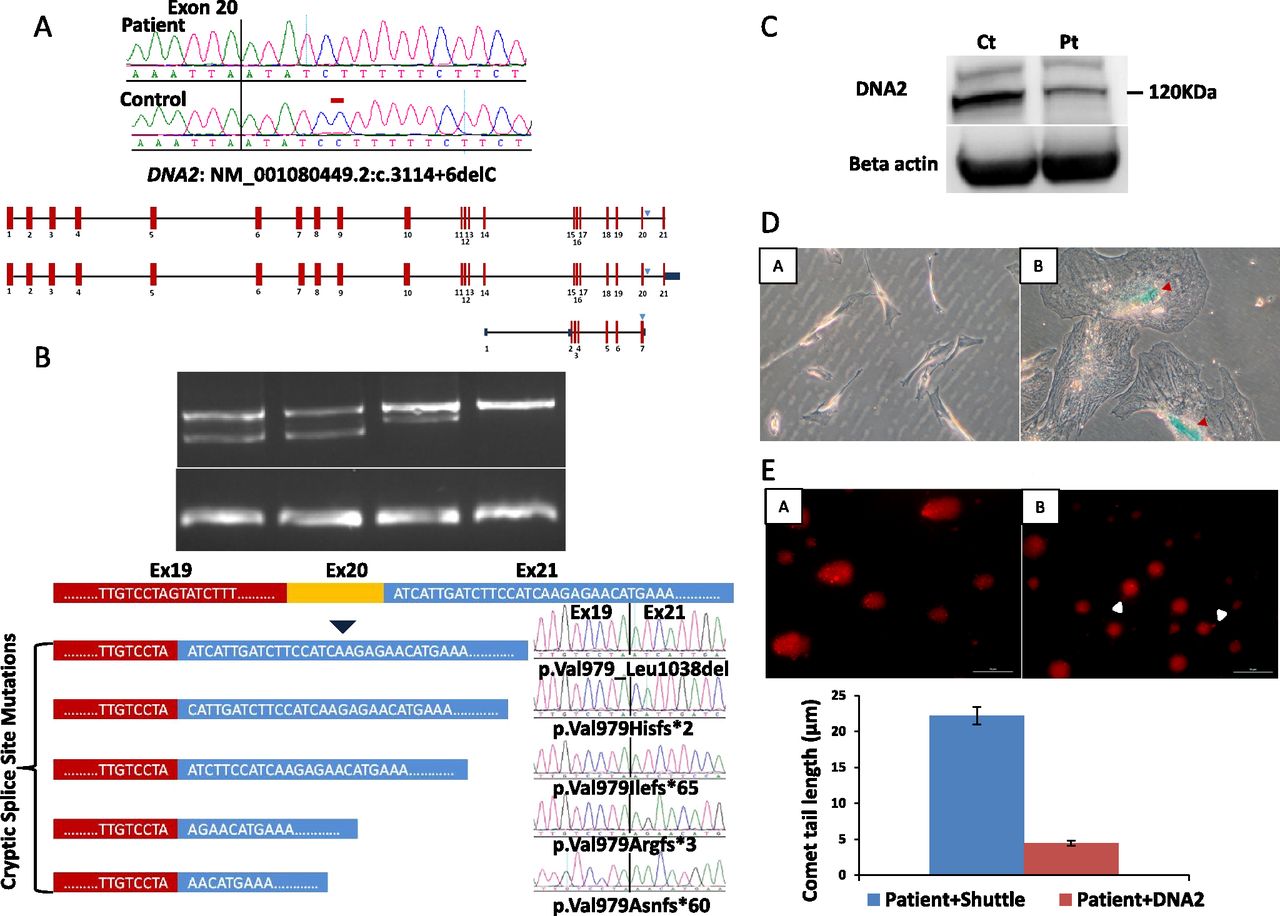
Identification of a novel DNA2 mutation that causes increased senescence and DNA damage in a family with Seckel syndrome. (A) Upper panel shows DNA sequence chromatogram with the novel 1-bp deletion variant identified in the two affected members of PD_F6, and a schematic of the three transcripts of DNA2 affected by the mutation. The site of mutation on the sequence chromatogram is denoted by a red bar, and blue triangles denote the position of the variant on the three DNA2 transcripts. (B) Upper panel shows the gel image of the RT-PCR that reveals the presence of an aberrant band in the two patients as well as the reduction of the normal band in Pt1 and Pt2 (23% and 53%, respectively). Note the absence of the aberrant band in the two controls. Lower panel shows a cartoon of DNA2 mRNA (only exons 19–21 are shown) and the result of cloning experiments on the RT-PCR product obtained from the patient RNA which revealed the presence of five aberrant transcripts, all sharing the same abnormal donor site, while each had a different acceptor site. (C) Immunoblotting using antibody against DNA2. The protein level of DNA2 from cells derived from index individual (Pt) were 50% reduced in comparison to the normal type control (Ct), respectively (the average of two independent experiments was 60%). (D) Images of beta-gal-stained control cells (A) and patient (B) showing the presence of blue staining and flattening of patient cells (red triangle). Please note that patient and control fibroblasts had a comparable number of passages (6–7). (E) Representative images and the quantification graph in the assessment of “comet tail” lengths from patient cells transfected with shuttle (A) and DNA2 (B). There was a significant reduction in the number of cells with comet tails as well as the size of comet tails (P = 4.4 × 10⁻⁶) obtained from the patient cells after exogenous expression of DNA2. Scale bar = 50 μm.


