
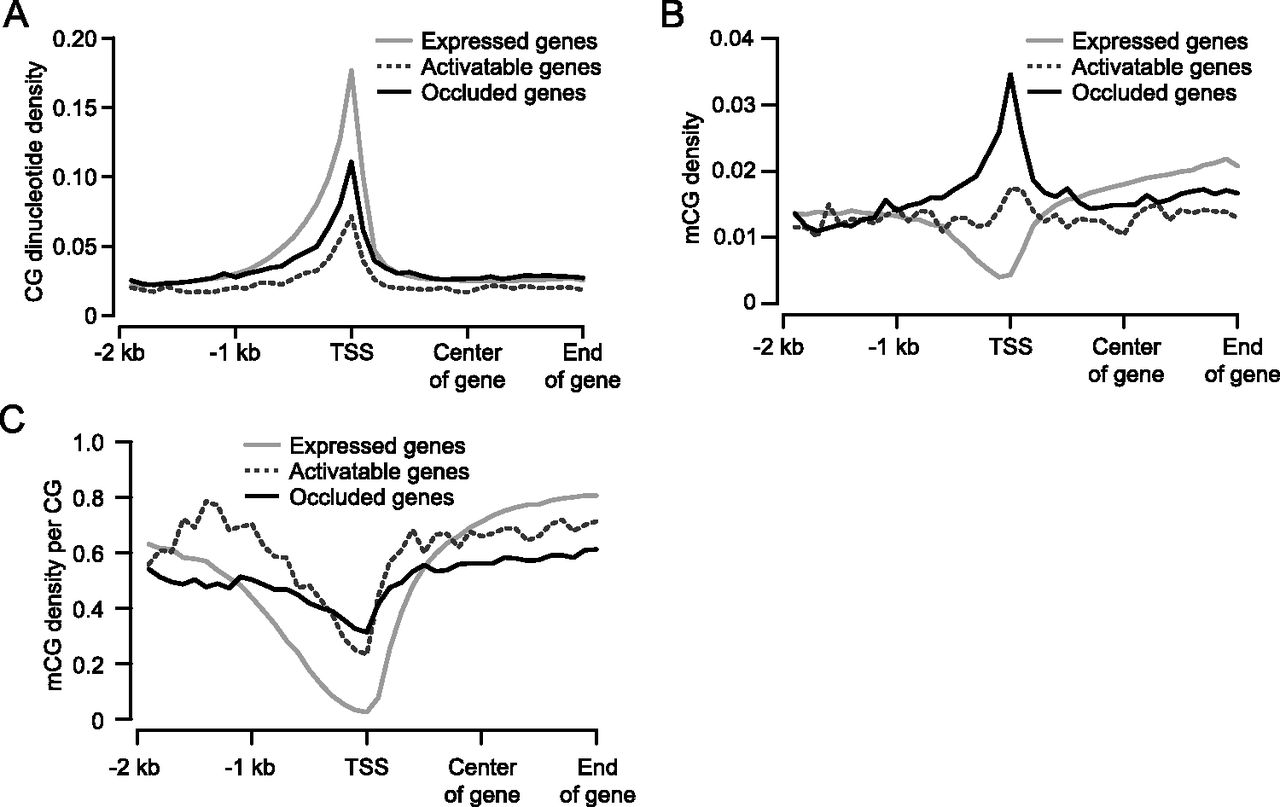
Figure 4.
DNA methylation profiles in promoter proximal regions of expressed, activatable, and occluded genes in 129TF. (A–C) Profiles of CG dinucleotide density (A), mCG density (B), and mCG density per CG (C), with mCG density showing the greatest difference between occluded and activatable genes.


