
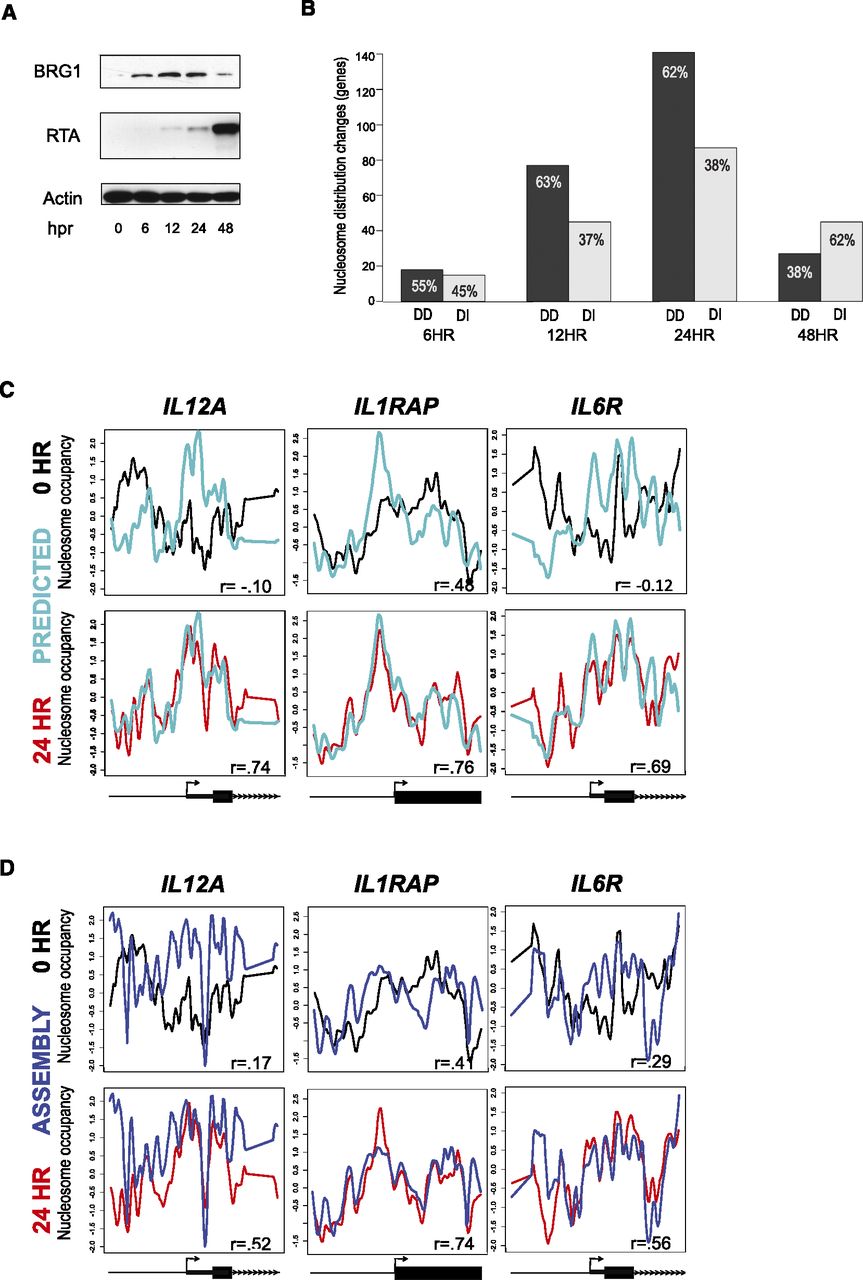
Nucleosome redistributions are determined by the underlying DNA sequence. (A) Western blots with the specified antibodies, at various times (in hours) after KSHV reactivation (hpr), of iSLK.219 cells treated with 0.2 µg/mL doxycycline. BRG1 protein levels peaked at 24 h. The RTA immunoblot is included to confirm KSHV reactivation. Beta-actin is included as a loading control. (B) Relative proportions of DNA-directed and DNA-independent nucleosome redistributions at 6, 12, 24, and 48 h post-KSHV reactivation. Approximately two-thirds of the genes with altered nucleosome occupancy at 12 h and 24 h were DNA-directed. (C) Observed and predicted (Gupta et al. 2008) nucleosome distributions. The nucleosome distributions from basal (black lines) KSHV, 24 h post-KSHV reactivation (red lines), and DNA-sequence-based prediction (cyan lines) for the same three genes shown in Figure 1D. The x-axis represents genomic position showing 2 kb centered on a TSS. The y-axis is the log2 ratio of nucleosomally protected DNA to genomic DNA signal at each probe on the microarray. These plots show strong agreement between the sequence-based model and the reactivated state. Gene models from the RefSeq annotations are shown below each gene column. (D) Measured and assembled nucleosome distributions. The nucleosome distributions from latent (black lines) KSHV, 24 h post-KSHV reactivation (red lines), and assembly (blue lines) for the same three genes shown in Figure 1D. The x-axis represents genomic position showing 2 kb centered on a TSS. The y-axis is the log2 ratio of nucleosomally protected DNA to genomic DNA signal at each probe on the microarray. These plots show strong agreement between the assembled and the reactivated state. Gene models from the RefSeq annotations are shown below each gene column.


