
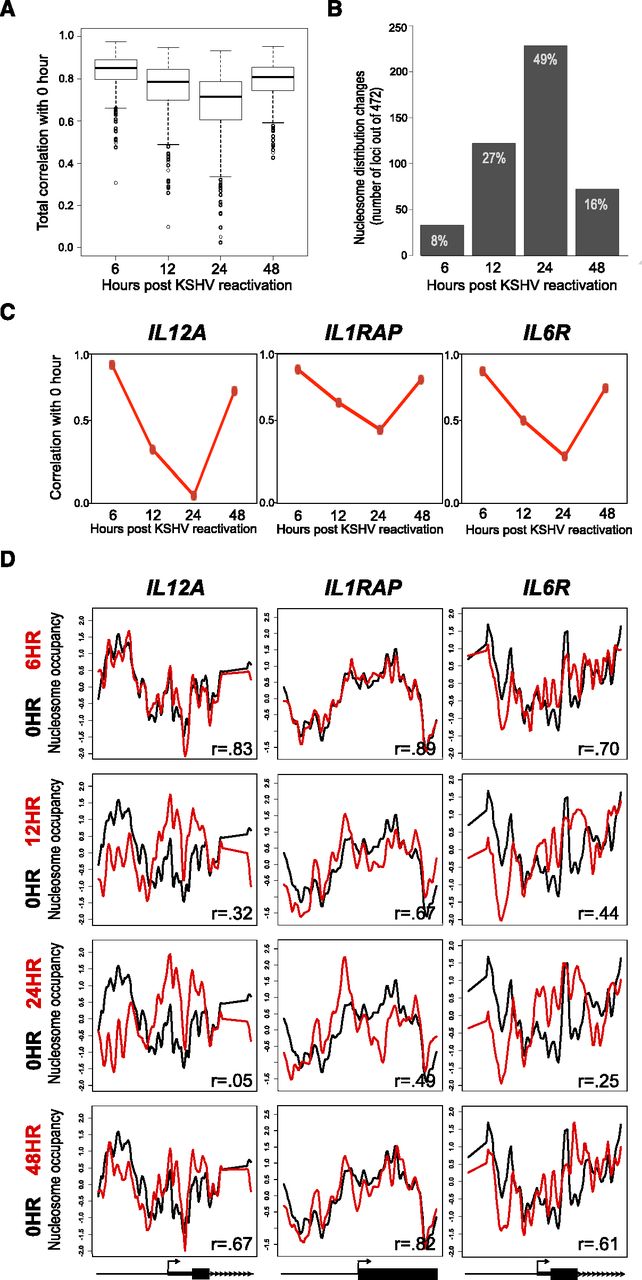
Reactivation of KSHV resulted in widespread, transient nucleosome redistribution. (A) Boxplot of the correlation values for the 472 loci nucleosome distributions between the 0-h time point and the time points following KSHV reactivation. (B) Number of loci with nucleosome distribution changes (r < 0.7) at 6, 12, 24, and 48 h post-reactivation of KSHV. The greatest number of nucleosome distribution changes occurred at 24 h, and the nucleosome redistributions transiently return to the basal state nucleosome distribution (0 h) at 48 h. (C) The correlation values between the nucleosome distributions of the 0-h and post-KSHV reactivation time points for the IL12A, IL1RAP, and IL6R TSSs. (D) The nucleosome distribution from latent (black lines) and reactivated (red lines) post-KSHV time points for three genes: IL12A, IL1RAP, and IL6R loci. The x-axis represents genomic position showing 2 kb centered on a TSS. The y-axis is the log2 ratio of nucleosomally protected DNA to genomic DNA signal at each probe on the microarray. Gene models from the RefSeq annotations are shown below each gene column.


