
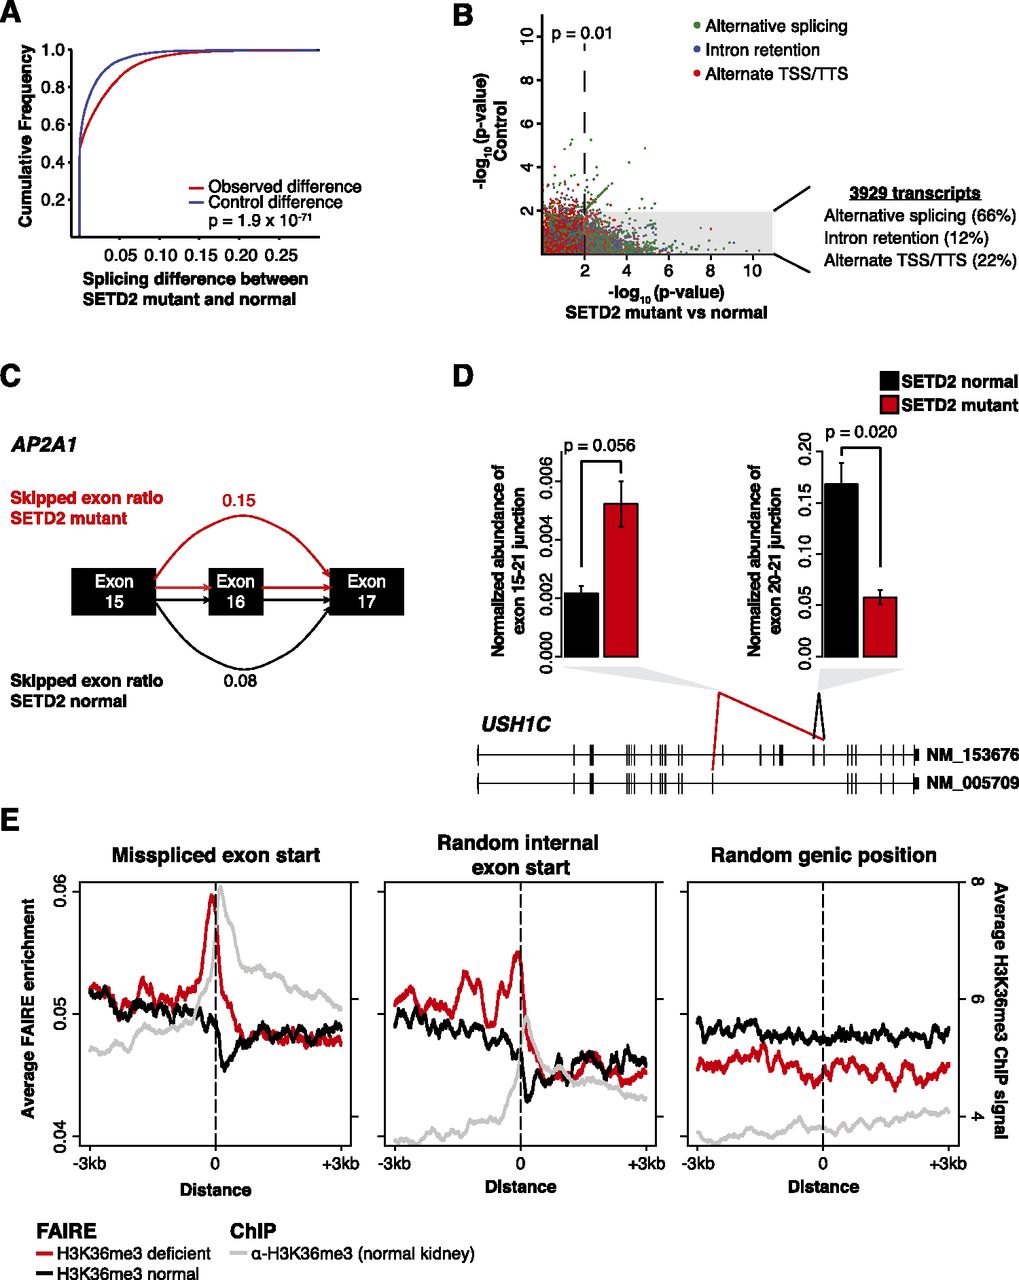
Widespread RNA processing defects linked with SETD2 mutations persist in the mature RNA pool and are marked by altered chromatin accessibility. (A) Splicing differences (see Methods) between SETD2-mutant and SETD2-normal tumors (red) compared with a permuted control (blue) are plotted as a cumulative distribution function. (B) Significance of the difference in ratios between SETD2-mutant and SETD2-normal tumors (x-axis) plotted against the scrambled control (y-axis). Points are colored by the class of RNA processing aberrancy. (Gray box) Significance (P = 0.01) in the SETD2-mutant–normal comparison, but not significant in the control comparison. The percentages of significant differences in transcript processing are also presented. (C) Schematic of AP2A1 splicing. Exon skipping was represented as the ratio of included exon coverage to the sum of the exon and the spliced form. The skipped exon ratio is provided for SETD2-mutant tumors (red) and SETD2-normal tumors (black). (D) Quantitative PCR across two USH1C alternative exon utilization sites identified by RNA-seq for three SETD2-normal tumors (black) and two SETD2-mutant tumors (red). Error bars represent standard error. (E) FAIRE signal plotted around the exon start (±3 kb) of misspliced exons (left), random internal exon starts (middle), and random genic positions (right) for H3K36me3-deficient tumors (red) and H3K36me3-normal tumors (black). (Gray) H3K36me3 ChIP-seq signal from normal kidney tissue.


