
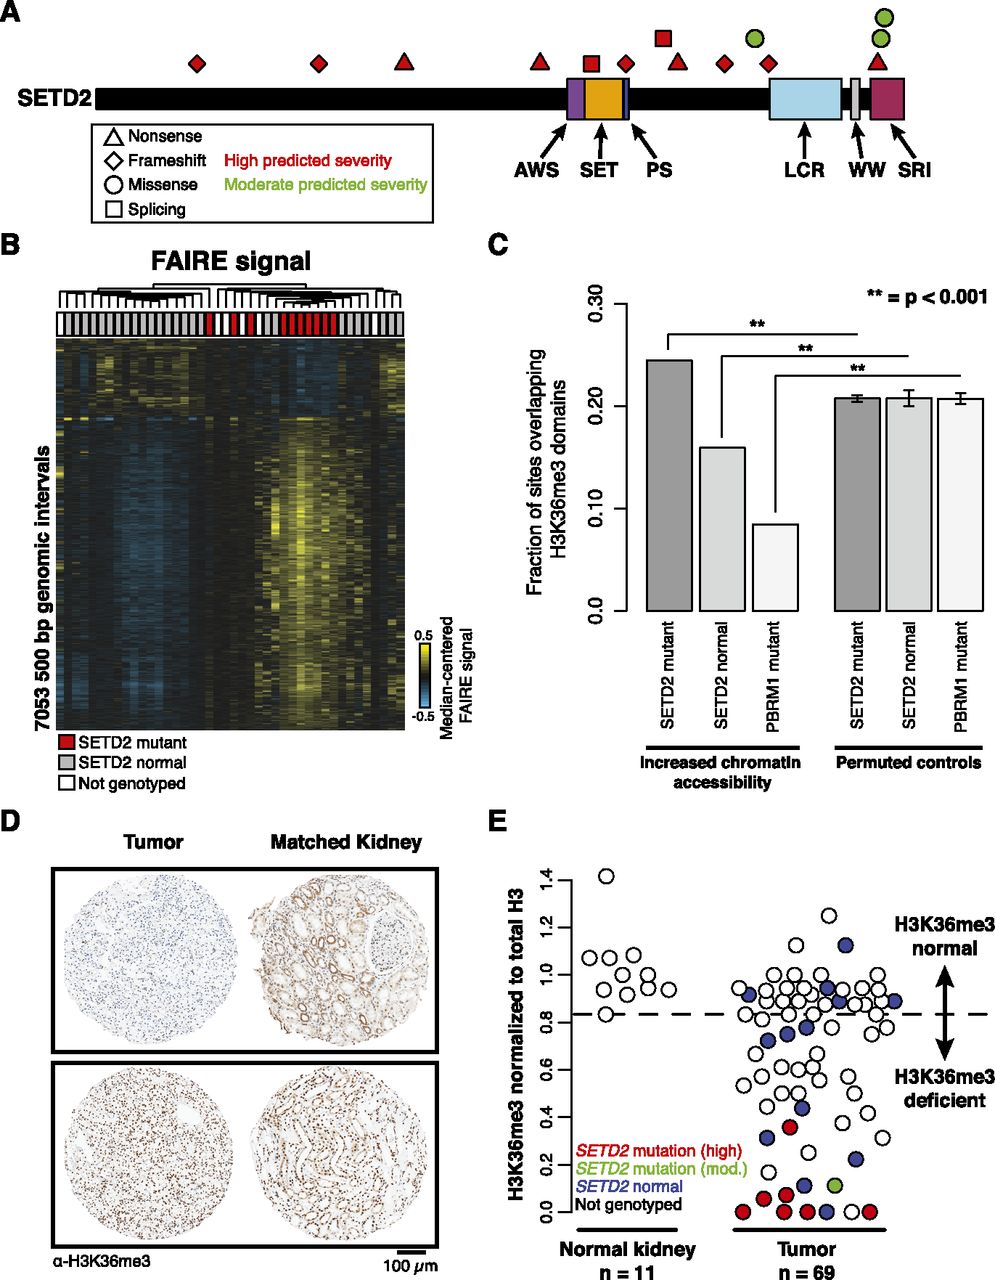
SETD2 mutations link H3K36me3 loss with changes in chromatin accessibility. (A) Schematic representation of SETD2 mutations predicted to have high or moderate severity on protein structure. (B) Hierarchical clustering of median-centered FAIRE signal in windows with significant differences between SETD2 mutant tumors (red) and tumors without SETD2 mutation (gray) (2-sided t-test, P < 0.01). (White) Samples not genotyped. (C) Proportions of nucleosome-depleted loci overlapping H3K36me3-marked regions compared with loci with permuted genomic coordinates. Error bars represent SD. (D) Representative immunostaining of two ccRCC tumor-normal pairs on the tissue microarray. (E) Quantification of H3-normalized H3K36me3 intensity across 11 normal kidney and 69 renal tumors. Mutation severity (high, red; moderate, green; none, blue) is indicated. (White) Samples with unknown SETD2 mutation status. The threshold for H3K36me3 deficiency was set to the lowest observed intensity in normal tissue (dashed line).


