
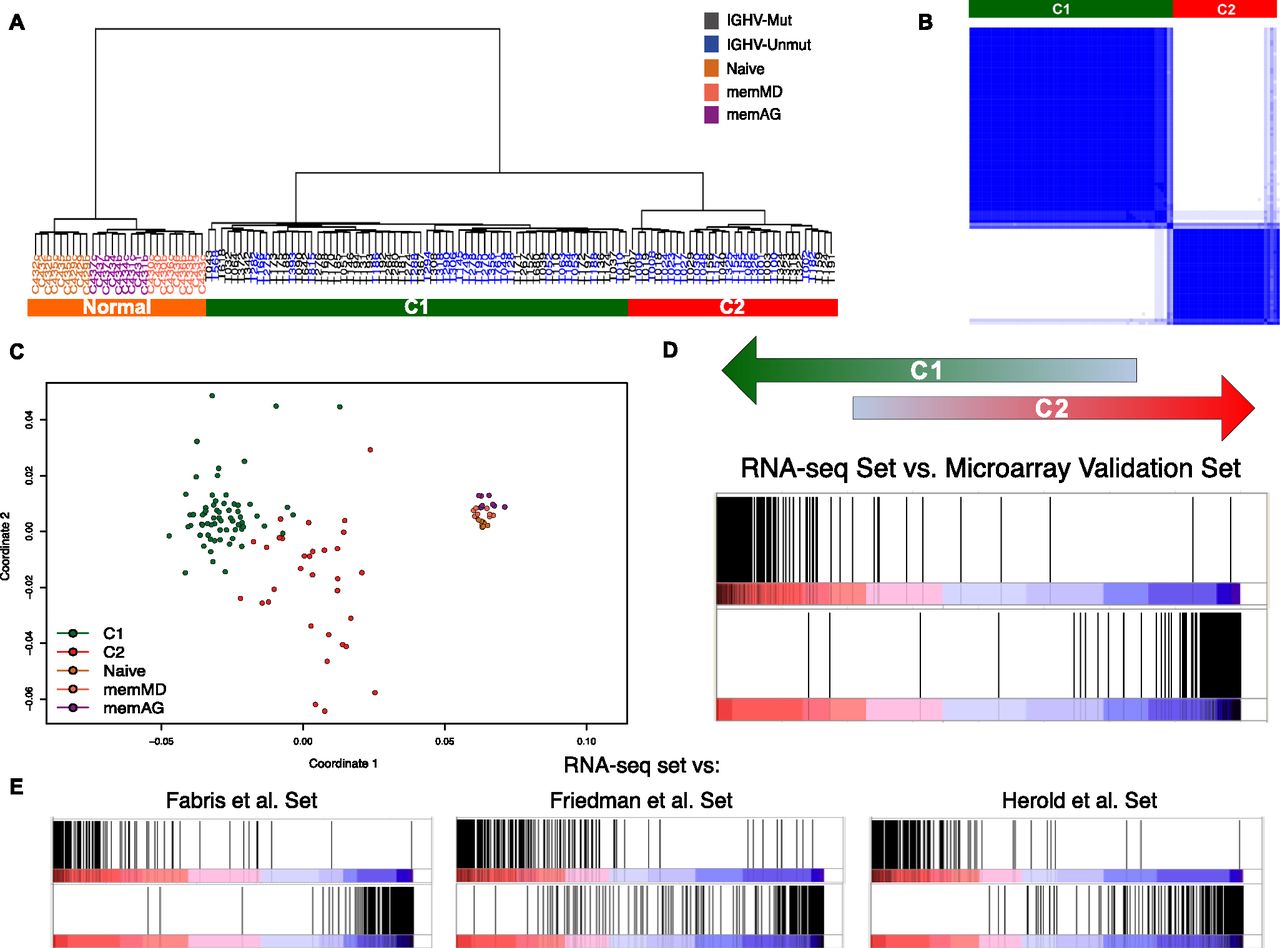
Major transcriptional CLL subgroups. (A) Clustering of CLL and normal samples. Dendrogram obtained by hierarchical clustering of CLL and normal samples. (B) Consensus cluster. The matrix shows a clear and robust separation between CLL samples in C1 and C2. Dark blue regions indicate cluster partitions for samples that always cluster together (high consensus) and white indicate partitions with low consensus. (C) Multidimensional scaling of CLL and normal samples according to gene expression. (D) Enrichment score plot by GSEA comparing the RNA-seq based clustering with the clustering of an independent set of 124 samples, profiled with expression arrays. The plot compares the ranking correlation of the list of genes from the two clustering solutions. The vertical dark lines indicate where the genes in one list appear in the other ranked list of genes. An accumulation at the extremes indicates an agreement between the two lists. (E) Enrichment score plot by GSEA comparing the clustering in the RNA-seq and the previously published data sets. The three previously published data sets (Fabris et al. 2008; Friedman et al. 2009; Herold et al. 2011) contained 60, 40, and 106 samples, respectively.


